


1. Introduction
Diabetes mellitus is a chronic condition for which patients may turn to alternative remedies that are purported to improve glycemic control. The long-term complications of untreated or ineffectively-treated diabetes include retinopathy, nephropathy and peripheral neuropathy. In addition, diabetic patients have an increased risk of cardiovascular disease and stroke [1]. Therefore, there is a strong need for safe and effective oral hypoglycemic/anti-diabetic agents that provide the clinician with a wider range of options for preventing, treating and managing diabetes. In this paper we have focused our attention on the spent hop extract isolated from Humulus lupulus L. as a potential agent used for anti-diabetic treatment. Humulus lupulus has a long history as a medicinal remedy to treat a wide range of complaints [2]. Hops have long been used in the brewing industry as a preservative and flavoring agent to add bitterness and aroma to beer. So far, hop polyphenolic substances have found to be very potent cancer chemopreventive agents [3]. In traditional Chinese medicine, hops are used to treat insomnia, restlessness, dyspepsia, and lack of an appetite. Alcoholic extracts of hops are clinical remedies used in China to treat leprosy, pulmonary tuberculosis, acute bacterial dysentery, silicosis, and asbestosis, all with positive outcomes [4]. However, so far the extracts of spent hops were not used in the treatment of diabetes. Recently, for the first time, xanthohumol (XN), a prenylated flavonoid from hops, has been tested for efficacy on biomarkers of metabolic syndrome in 4 week old Zucker rats, a rodent model of diabetes and obesity. Rats received daily oral various doses of xanthohumol for 6 weeks.
The study showed that this flavonoid is able to exert beneficial effects on body weight and glucose metabolism. It was suggested that xhanthohumol holds promise as a therapeutic agent for treating obesity and disregulation of glucose metabolism [5]. These hopeful facts on XN activity prompted us for using the whole spent hop extract, and not only any single polyphenolic component, to check its hypoglycemizing activity in the model of experimental diabetes.
Mitochondria are the primary source of energy generation within cells. Thus cardiac mitochondrial dysfunction is expected to induce deleterious cellular effects, ultimately leading to heart disease. Cardiac mitochondrial function has been less well studied in human subjects, possibly due to the difficulty of obtaining appropriate human heart tissue samples for in depth investigations of mitochondrial functional capacity. However, a number of studies provide indirect evidence for altered cardiac mitochondrial function in diabetic patients [6,7]. In contrast to studies on humans data, mitochondrial function has been directly studied in multiple animal models of diabetes (resembling Type 1 and Type 2 diabetes in humans). To understand the physiological and pathological changes occurring in this complex disease, animal models of diabetes are important research tools, since they allow for tight control over experimental conditions, which is almost impossible to achieve in human populations. These models have been used to study several aspects of mitochondrial bioenergetics and function in diabetic states. The animal model investigations provide conclusive evidence that mitochondrial function is impaired in the hearts of animals with insulin resistance and diabetes [8]. It is very important to know the triggering mechanisms of the changes leading to heart failure in the diabetes, because mitochondria are the most abundant organelles in cardiac muscle and play leading roles in energy production, oxidative stress and life-death cycle regulation [9]. It was well documented that diabetic hearts showed damaged mitochondria and myofibrils, reduced myocyte contractility, slowed intracellular Ca2+ decay, and increased MDA-modified proteins compared to control (non-diabetic) myocytes. The structural damage to diabetic mitochondria and the efficacy of mitochondrial inhibitors in reducing ROS suggest that mitochondria are a source of oxidative damage in diabetic cardiomyocytes [10]. Additionally, it was noted that for the increased oxygen consumption and increased fatty acid (FA) utilization observed in the hearts of diabetic animals with obesity two major phanomena may be responsible: the uncoupling of mitochondrial oxidative phosphorylation (OXPHOS) and oxygen wastage [11]. Despite the fact that more and more papers arise in this topic every year, the precise mechanisms underlying the causes of heart diabetic mitochondria alterations are still unclear and more studies are needed to better explain these processes. In light of this, we employed a rat model of diabetes to test the heart mitochondrial bioenergetic capacity and the impact of spent hop extract on this biological system, because we hoped to add some new data on this subject.
As the health-protective actions of xanthohumol against cardiovascular disease and type 2 diabetes have been documented in the literature [5,12], the current study was undertaken to test, for the first time, the hypothesis that spent hop extract (isolated from Humulus lupulus L.) is able to prevent and/or improve the mitochondrial bioenergetics and the coronary flow of rat heart tissue in streptozotocin-induced diabetes. To this end, the activity of the mitochondrial electron transport chain in heart mitochondria isolated from STZ-induced rats was quantitatively evaluated in the course of the 3-point progression of diabetes: 1, 2.5 and 5 months of confirmed diabetic state. An additional aim is to comment on the potential use of the tested extracts or other bioactive ingredients in treating of the disease. The acquired results are discussed in detail in order to provide a complete picture of the application of the spent hop extract in the treatment of diabetes complications. Another line of reasoning concerns the potential risks of the improper planning, designing and performance of experiments, potentially leading to draw incorrect/misleading conclusions. Understanding the advantages and disadvantages of the experimental model used in the present study, as well as the correct interpretation of the results, may have implications for future studies using similar animal models.
2. Materials and Methods
2.1 Chemicals
Succinate (S 2378), rotenone (R 8875), oligomycin (O 4876), FCCP (carbonyl cyanide p-trifluoromethoxyphenylhydrazone, C 2920), antimycin A (A 8674), dispase II (D 4693), streptozotocin (S 0130), gallic acid (G 7384), vanillin (120804), 3,5-dinitrosalicylic acid (DNS, 128848), (+)-catechin (C 1251), formic acid (85178) and methanol (179337) were purchased from Sigma-Aldrich Chemicals Co (Steinheim, Germany). Acetonitrile (1000291000) was purchased from Merck (Darmstadt, Germany). Quercetin-3-Oglucoside (1347 S), quercetin 3-O-rutinoside (1139 S), (-)epicatechin (0978 S), procyanidin B2 (0984), and kempferol-3-O-glucoside (1243 S), kempferol-3-O-rutinoside (1139 S) were purchased from Extrasynthese (Lyon, France). Accucheck Active glucose strips were from Roche Diagnostics Polska Ltd. (Warsaw, Poland). Kits for determination of glycated hemoglobin (HbA1c, AJ 3128) were from Drew 103 Scientific Ltd. (Barrow-in-Furness, Cumbria, United Kingdom). Ketamine and sedazin for animal anaesthesia were purchased from Biowet-Pulawy (Poland). All other reagents and solvents used in this study were of the highest analytical reagent grade.
2.2 Plant material and extract preparation
The spent hops (Humulus lupulus L.), after extraction by supercritical CO2, were supplied by the Fertilizer Research Institute, Pulawy (Poland). Dried material was ground to fine powder in a commercial coffee grinder. The sample was added to an acetone-water mixture (70:30, v/v) at a solid to liquid ratio of 1:10 (w/v), mixed at room temperature for 30 min and then centrifuged for 15 min (4000 rpm). The pellet was re-extracted twice with 70% aqueous acetone for 15 min and the supernatants combined. The resulting liquid was then evaporated at <40°C under reduced pressure (Rotavapor RII, Büchi, Switzerland) and the water solution was extracted with chloroform (four-fold, 1:1 v/v). The water fraction was concentrated in vacuum and freeze-dried (Alpha 1-2 LD plus, Christ).
2.3 Basic constituent analysis
The protein content of the spent hops extract was determined as total nitrogen content by the Kjeldahl method. Ash content was determined by weight difference before and after incineration at 550°C for 16 h. Reducing sugar concentration was estimated by the Miller method with alkaline 3’,5’-dinitrosalicylic acid (DNS) solution [13]. Total acidity was determined by titration of water solution of extract with 0.1 M NaOH to an end point of pH 8.1 according to PN- 90/A-75101/04, and was expressed as citric acid equivalents.
2.4 Quantification of phenolic compounds by spectrophotometric methods
The dried extract was reconstituted in 2 mg/ml of 10% aqueous dimethyl sulfoxide (DMSO) before analysis. Total phenol content was determined using the Folin-Ciocalteu reagent [14] Gallic acid was used as a reference standard, and the results were expressed as gram gallic acid equivalents (g GAE)/100 g of extract. The amount of total flavanols was measured according to the vanillin method [15] and the results were expressed as gram (+)-catechin equivalents (g CE)/100 g of extract. The proanthocyanidins were determined after acid depolymerization to the corresponding anthocyanidins [16]. The content of proanthocyanidins was calculated by the molar extinction coefficient of cyanidin (ε = 17360 L mol-1cm-1 and molar mass 287 g mol-1) and was expressed as gram cyanidin equivalents (g CYE) per 100 gram of extract.
2.5 Identification of polyphenols by the Ultra Performance Liquid Chromatography-Mass Spectrometry (UPLC-MS) method
Identification of polyphenol of extracts carried out using an Acquity Ultra Performance LCTM system (UPLCTM) with binary solvent manager (Waters Corporation, Milford, USA) and a Micromass Q-Tof Micro mass spectrometer (Waters, Manchester, U.K.) equipped with electrospray ionization (ESI) source operating in negative and positive mode. For instrument control, data acquisition and processing, MassLynxTM software (Version 4.1) was used.
Separations of individual polyphenols were carried out using a UPLC BEH C18 column (1.7 μm, 2.1 × 50 mm, Waters Corporation, Milford, USA) at 30°C. Samples (10 μL) were injected and elution completed in 15 min with a sequence of linear gradients and 0.45 mL min-1 isocratic flow rates. The mobile phase was composed of 4.5% formic acid, v/v (solvent A) and 100% of acetonitrile (solvent B). The program began with isocratic elution with 99% A (0-1 min), and then a linear gradient was used until 12 min, which lowered A to 0%; the mixture then returned to the initial composition (99% A) from 12.5 to 13.5 min, and was then held constant to re-equilibrate the column.
Analysis was carried out using full scan, data-dependent MS scanning from m/z 100 to 1500. The mass tolerance was 0.001 Daltons and the resolution was 5.000. Leucine enkephalin was used as the internal reference compound during ESI-MS accurate mass experiments and was permanently introduced via the LockSpray channel using a Hamilton pump. The Lock Mass Correction was +/– 1.000 for Mass Window. All TOF-MS-chromatograms are displayed as Base Peak Intensity (BPI) chromatograms and scaled to 12400 counts per second (cps) (= 100%). The effluent was led directly to an electrospray source with a source block temperature of 130°C, desolvation temperature of 350°C, capillary voltage of 2.5 kV and cone voltage of 30 V. Nitrogen was used as the desolvation gas with a flow rate of 300 L h-1.
The characterization of the single components was carried out via the retention time and the accurate molecular masses. Each compound was optimized to its estimated molecular mass [M-H]-in the negative mode before and after fragmentation. The data obtained from UPLC/ MS were subsequently entered into the MassLynx 4.0 ChromaLynxTM Application Manager software. Based on these results, the software is able to scan different samples for the characterized substances.
2.6 Animals and husbandry
Male rats of Sprague-Dawley strain weighing approximately 240- 380 g were used in this experiment. Before the commencement of the experiment, the animals were acclimatised to the laboratory conditions for a period of 2 weeks, during which they were maintained at an ambient temperature of 25°C and the 12/12 h of a light/dark cycle. Animals were given standard commercial rat chow and water ad libitum and were housed under standard environmental conditions until treatment or sacrifice. The experiments were conducted in accordance with the Guide for the Care and Use of Laboratory Animals published by the US National Institute of Health (NIH Publication No. 85-23, revised 1985), as well as with the guidelines formulated by the European Community for the Use of Experimental Animals (L358-86/609/EEC) and the Guiding Principles in the Use of Animals in Toxicology (1989). All experiments were carried out with the approval of an appropriate institutional local ethics committee (no. 15/LB416/2008).
2.7 Induction of type I diabetes in rats
Diabetes was induced by an intraperitoneal injection of streptozotocin (STZ, dissolved in 0.1 mol/l citrate buffer, pH 4.5) at the dose of 70 mg/kg body weight. Diagnosis of diabetes was made on the basis of the non-fasting blood glucose concentration, measured in the morning hours, 08:00-10:00 AM. The animals with blood glucose concentrations higher than 16.7 mmol/l, were considered diabetic and included to the study. Each STZ-injected rat showing hyperglycemia lower than 16.7 mmol/l at 72 h after STZ injection was excluded from the study. The investigations of the effect of the plant extract, administered at a daily dose of 5 mg/kg body weight, started after 7 days upon induction of laboratory confirmed diabetes. At the termination of the experiment, the survivors in both groups were sacrificed and their blood and hearts were collected for further biochemical analyses.
2.8 Groups and treatment
The experimental animals were randomly divided into three groups of 20 rats, and the treatment group was further subdivided based on the duration of hop extract treatment. Group 1- healthy non-diabetic rats, receiving only fresh water; group 2 - animals with streptozotocininduced diabetes, receiving only fresh water; group 3 - animals with streptozotocin-induced diabetes given spent hop extract (ad libitum in water) at the dose of 5 mg/kg body weight, once daily for either 1 month, 2.5 months or 5 months, depending on the subgroup.
The dose of plant extract was chosen based on the results obtained in the ‘survival experiment’, a pilot study conducted 6 months earlier (data not shown). In this experiment, STZ-induced animals were given spent hop extract, in water ad libitum, once daily for a maximum of 6 months. The objective being to choose the safe dose of plant extract, i.e. the dose of plant extract which did not affect survival, over the course of 6 months of STZ-diabetes. Of the 3 doses tested, 2.5 mg/kg b.w., 5 mg/kg b.w. and 10 mg/kg b.w., the most suitable was found to be 5 mg/kg b.w., which went on to be used in the present study. It was found that diabetic rats supplemented with 5 mg/kg spent hop extract had significantly the longest survival time that the placebo or 2.5 and 10 mg/kg treated counterparts.
Blood collection and glucose level determination: In-life nonfasting blood glucose (measured always at 09:00-10:00 AM) was measured once in control non-diabetic animals and monitored weekly in all STZ diabetic animals under study. Blood was obtained from tail vessels by needle prick and tested using glucose strips or, when exceeding 600 mg%, by biochemical analysis. The final determination of blood glucose was recorded at time preceding the critical event (within a week) and referred respectively to as terminal glucose.
2.9 Glycated hemoglobin (HbA1c) level determination
Glycated hemoglobin (HbA1c) was analyzed using a commercial kit (Drew Scientific Ltd., Barrow-in-Furness, UK). Measurements were performed with the DS5 HbA1c analyzer (Drew Scientific Ltd.), and the results expressed as the percent fraction of total hemoglobin.
2.10 Isolation of rat heart mitochondria
Mitochondria were isolated according to Ferko et al., (2008) with small modifications [17]. Briefly, the hearts were dampened with a small volume of ice-cold isolation solution (IS, containing in mmol/l: 250 mmol/l sucrose, 0.5 mmol/l EDTA, 10 mmol/l Tris and 1 g/L bovine serum albumin, pH=7.4), then cut into small pieces with scissors and left together with 10 ml of IS with the added dispase II (2.5 mg/g wet heart wt.) for 10 min. The pieces of heart were then transferred to a teflon/glass homogenizer and homogenized gently for 2-3 min. After centrifugation of the homogenate at 800 x g for 10 min (4°C), the protease-containing supernatant, together with the fraction of mitochondria which was in direct contact with the protease, was centrifuged at 4800 x g, 10 min, 4°C. The pellet was resuspended in the same volume of IS but without protease, and again centrifuged (4800 x g, 10 min, 4°C). The final centrifugation of pellet was done at the same conditions describe above. Finally, the pellet containing rat mitochondria was again resuspended in the ice-cold isolation solution (IS buffer, pH 7.4). Mitochondrial protein content was determined by the Bicinchoninic Acid Kit.
2.11 Mitochondrial respiratory measurements
The oxygen consumption of the isolated mitochondria was monitored at 37°C, using a Clark oxygen electrode connected to a high resolution respirometer (OROBOROS, Oxygraph, Innsbruck, Austria), and the suspension of mitochondria was placed in a chamber with a stopper and a magnetic stirring. We evaluated the oxygen consumption rates as a time-derivative traces, using the DatLab software for data acquisition and analysis (OROBOROS®). The respiration medium consisted of 110 mmol/l sucrose, 60 mmol/l K-lactobionate, 0.5 mmol/l EGTA, 1 g/L BSA essentially fatty acid free, 3 mmol/l MgCl2, 20 mmol/l taurine, 10 mmol/l KH2PO4, 20 mmol/l HEPES adjusted to pH 7.1 at 37°C (MIR05 buffer) mixed with catalase (280 IU/ml) to form MIR06 buffer. Before measurements we equilibrated the oxygraph chambers for 30 to 40 min with air, using the stirring (at 540 to 560 rpm) to make sure of signal stability for calibration at air saturation.
To calculate the corresponding oxygen concentration we employed the digitally recorded barometric pressure and the tabular data of the oxygen solubility at 37°C. Instrumental background flux was measured separately using the same medium without mitochondria.
2.12 Design of respirometric protocol
Isolated rat heart mitochondria (0.2 mg of protein/ml for each measurement of respiration), respiratory substrate for the complex II (10 mmol/l succinate) and respiratory inhibitor for the complex I (0.5 μM rotenone) were added to the standard respiration medium, MIR06 (2 ml) containing isolated mitochondria. Respirometric states were then induced by the addition of substrates for a specific respiratory complex. We monitored the respiration typical for in State 2, State 3, State 4 and State E. In State 2 it remains slow, mainly compensating for the passive proton leak and the activity of inner membrane ion channels, such as uncoupling proteins or the permeability transition pores. In State 3, when titrating with low but saturating concentrations of ADP, the respiration is activated by the back-flow of protons into the matrix through the ATP synthase and the concomitant partial drop of the electrochemical proton gradient across the inner mitochondrial membrane. When the used exogenous ADP (0.25 mM) becomes “exhausted” (phosphorylated to ATP), the respiration returns to a resting level, referred to as State 4, which appears elevated above state 2 if ATPase activity recycles ATP to ADP.
The FCCP-uncoupled respiration was performed by adding 1.5- 2 μM of FCCP (carbonyl cyanide p-trifluoromethoxyphenylhydra zone) to mitochondria energized with a succinate (State E). Finally, antimycin A at 2.5 μM was added to completely inhibit the complex III and bring the electron transfer system (ETS) into a ROX state (Residual Oxygen consumption remains). ROX corresponds to the residual respiration after application of ETS inhibitors to mitochondrial preparation(s). The values of ROX were measured individually for every mitochondrial sample and then the values of “ROX respiration” were subtracted from the values attributed to other designated states (States 2-4, State E).
2.13 Mitochondrial parameters
The following mitochondrial respirometry parameters were measured:
- Leak respiration (State 2)-mitochondrial respiration in the presence of exogenous added substrates and inhibitors.
- State 3 respiration-it is the ADP stimulated respiration of isolated coupled rat heart mitochondria in the presence of saturating ADP and Pi concentrations, supported by succinate as a substrate at saturating oxygen level.
- State 4 respiration-it is the respiratory state obtained in isolated rat heart mitochondria after State 3, when added ADP is phosphorylated completely to ATP driven by electron transfer from respiratory substrates to O2.
- State E (ETS capacity)-it is a respiratory Electron Transfer System capacity of rat heart mitochondria in the experimentally induced non-coupled (fully uncoupled) state, in the mitochondrial preparations with succinate as a substrate. This state is induced by FCCP addition.
- ROX state-induced by Antimycin A addition.
Respiratory Control Ratio (RCR), Leak Control Ratio (L/E) and Phosphorylation System Control Ratio (P/E) were calculated according to the procedure described in [18].
- RCR (Respiratory Control Ratio) – is measured as State3/State 4.
- L/E ratio (Leak Control Ratio) – is measured as a ratio of ‘leak’ respiration (State 2) to ETS capacity (State E).
- P/E (Phosphorylation System Control Ratio) – is measured as a ratio of State 3 to ETS capacity (state E).
2.14 Measurements of coronary flow
The animals were anesthesized with intramuscularly injected ketamine and sedazine (10 mg/kg body weight and 100 mg/kg body weight, respectively). The thoracic cavity was opened, the heart was rapidly excised and transferred to heparinized (10U/ml) cold Krebs- Henseleit (K-H) buffer (NaCl 118 mmol/l, NaHCO3 25.0 mmol/l, KCl 4.7 mmol/l, KH2PO4, 1.2 mmol/l CaCl2, 1.2 mmol/l, MgSO4 1.2 mmol/l, glucose 11.0 mmol/l; pH 7.4). Heart was cannulated via aorta and connected to Langendorff apparatus (ADI Instruments, USA). Both atria were excised and heart was retrograde perfused with K-H buffer at constant pressure of 73 mm Hg and temperature of 37°C. Buffer was saturated with carbogen (95% O2, 5% CO2). Coronary flow (ml/min) and perfusion pressure (mm Hg) were constantly monitored and recorded with the use of PowerLab Recorder software (AD Instruments). Vasoactive compounds were diluted in K-H buffer. Perfusion was carried out according to the following protocol: hearts were perfused with K-H buffer for 15 min to stabilize flow parameters. Afterwards bradykinin was administered by infusion pump connected via Y luer stopcock mounted above the cannula. Rate of bradykinin administration was adjusted to actual perfusion rate to maintain constant concentration of bradykinin at a desired level. The following concentrations of bradykinin were administered: 0,1; 1; 10 or 100 nmol/l. Each administration time was 2 min and it was followed by 5 min of refraction period. To obtain the state of maximal relaxation and to test the endothelium independent relaxation nitric oxide donor DEA/NO was applied via Y luer stopcock mounted above cannula in the similar way as bradykinin at a final concentration of 1 μmol/l. The system was switched to perfusion with K-H buffer containing non-selective nitric oxide synthase (NOS) inhibitor L-NAME at final concentration of 300 μmol/l to monitor the flow in the state of absence of main endothelial derived vasodilator i.e. NO. Coronary flow data were expressed as ml/min.
2.15 Statistical analysis
All measurements were performed in duplicate. Data normality was checked using the Shapiro-Wilk test and variance homogeneity was verified with Levene’s test. Then, data with evidenced normality were analyzed with parametric tests. The statistical significance between homogenous groups was estimated using one-way ANOVA and post hoc Tukey tests. For both the in vitro and in vivo experiments, the sample size was estimated for type I and II statistical errors of 0.05 and 0.8, respectively. Furthermore, the power of used tests was also checked for each analysis. Only the differences with a post hoc statistical power values above 80% were considered appropriate to formulate any reliable and constructive conclusions. All statistical calculations were made with the use of STATISTICA.PL v.9 (StatSoft) and StatsDirect (StatsDirect Limited).
3. Results
3.1 Chemical identification of polyphenol extract isolated from Humulus lupulus
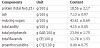
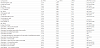
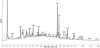
Hops are used primarily as a flavoring and stability agent in beer. Essential oils, terpenophenolic, and phenolic compounds are important constituents of hops. Spent hops, which are the residue from hops after their extraction by supercritical CO2, may be a valuable source of bioactive polyphenols. The total phenol content of spent hops extract obtained in the present study was about 24% (Table 1). About half of the phenolic compounds were flavanols, which are present in plants as catechins (monomeric forms), and proanthocyanidins or condensed tannins (oligomers and polymers). A total of 10 flavan-3-ols were identified in spent hop extract using high-performance liquid chromatography-mass spectrometry (Table 2). Two monomers ((+)-catechin and (-)-epicatechin), four dimers and four trimers were detected. Moreover, the spent hop extract contained four hydroxycinnamates: neochlorogenic acid, chlorogenic acid, cryptochlorogenic acid, and feruloylquinic acid. Flavonols were represented by quercetin and kaempferol derivatives. The chromatograph of all phenols presented in the extract tested in this paper is shown in Figure 1.
3.2 Effect of spent hop extract on body weight changes
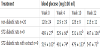
Spent hop extract did not prevent body weight loss in diabetic rats. The reduction in animal body weight was similar for two tested diabetic groups: those treated and those not treated with the plant extract. The only significant difference in body weight was observed between healthy animals and diabetic animals. Healthy animals were much heavier in comparison to diabetic rats (Table 3).
3.3 Effect of spent hop extract on glucose level
Both tested diabetic groups, either with or without plant extract supplementation, were found to exhibit a higher glucose level than the group of healthy rats. As shown in Table 4, the plant extract neither reduced nor increased the glucose concentration in diabetic rats. It was evidenced that regardless of diabetic animal exposure to plant extract, the level of hyperglycemia was not changed throughout the experiment, which suggests that it is not influenced by hop extract.
3.4 Effect of spent hop extracts on glycated hemoglobin (HbA1c) level
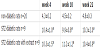
Statistically significant differences in the level of HbA1c were only observed between healthy and diabetic rats. As shown in Table 5, the elevated level of glycated hemoglobin (HbA1c) in the diabetic rats was unchanged after the treatment with plant extract in comparison to non-treated diabetic animals, which strongly implies that spent hop extract does not influence HbA1c level.
3.5 Effect of spent hop extract on mitochondrial function - Comparison between healthy and diabetic subjects non-treated by spent hop extract
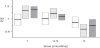
As shown in Figures 2-4 and in Table 6, no statistically significant changes in measured mitochondrial parameters (RCR, L/E, P/E, States: 2-4, State E) were observed between non-diabetic and diabetic rats. The RCR ratio gives information about the state of mitochondrial coupling, higher values being associated with better mitochondrial functionality. In all groups, RCR was found to fall over the course of the experiment, and the lowest values were observed in two animal groups in the fifth month of the experiment (p<0.01). No significant differences were observed between the groups of diabetic and non-diabetic rats, nor between samples taken during the course of the experiment, with regard to L/E, which relates to the state of mitochondrial uncoupling, or P/E, which relates to the mitochondrial respiratory condition.
3.6 Effect on spent hop extract on mitochondria isolated from STZrats
The response of heart mitochondria isolated from rats with STZinduced diabetes following 1, 2.5 or 5 month-supplementation with hop extract is shown in Figures 2-4. Although statistically significant changes were observed for RCR and P/E over time, no differences were found between the three groups of subjects: changes were only observed for each of tested animal groups dependent on time-point measurement. It was noticed that the mitochondrial respiratory capacity, as indicated by RCR, lowers over the course of diabetes. Additionally, this observation has been supported by the other parameters (States: 2-4 and State E) which changes were influenced by the duration of diabetes rather than the studied pathology (Table 6).
Paradoxically, the P/E parameter decreased together with the level of diabetes severity, indicating a reduction in the level of respiratory inhibition caused by this disease. However, this result contradicts the observed trends demonstrated by RCR and L/E, which clearly show that the respiratory activity of measured mitochondria was inhibited and strictly depends on time, or rather, that the longer diabetes lasts, the further mitochondrial functionality decreases. The supplementation of diabetes-induced rats with hop extract neither improves nor worsens the mitochondrial respiration of the heart.
3.7 Effect of spent hop extract on coronary flow
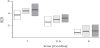
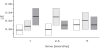
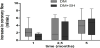
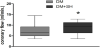
Multiple parameters of coronary flow measured in our protocol were unaffected by supplementation with the extract (Figure 5). The only parameter which was improved by the supplementation was coronary flow in presence of L-NAME i.e. NO-independent flow in the 5th month of supplementation (Figure 6).
4. Discussion
The present study demonstrates the effect of polyphenol extract obtained from spent hops (Humulus lupulus L.) on heart mitochondria isolated from STZ-induced diabetic rats. In addition, we report the most important and most likely causes of the misfortune in proving of the scientific hypothesis, which has assumed that tested plant extract improved the energetic status impaired by diabetes in rat heart mitochondria.
In light of the tremendous cost of diabetes, in terms of both human suffering and financial cost, it is highly desirable to have additional agents to support therapeutic treatment or for the formulation of specialty foods, beverages and diet supplements. Therefore the aim of this study was to prepare the extract from spent hops and check it for its capacity to improve the diabetes-impaired functioning of mitochondria by ‘recovering’ their bioenergetic capacity. Unfortunately, despite the use of an animal model with STZ-induced diabetes, well described in the literature [19,20] and in our own previous studies [21,22], it was not possible to confirm that rat heart mitochondria are detrimentally affected by diabetes.
At least three reasons can be given for this. First, diabetes mellitus is an extremely complex disease involving the interplay of seasonal fluctuations, dietary and genetic factors resulting in obtaining results which cannot be compared with those obtained in other studies.
Hence, the same animal model could generate non-comparable data over many months of in vivo research. Second, the Sprague-Dawley strain rat is arguably not a good choice as a diabetes model for studying heart mitochondria. The third reason may be linked to the unsuitable experimental protocol taken to assess the mitochondrial bioenergetics.
Regarding seasonal fluctuations, the response to test compounds by mitochondria isolated from healthy animals as well as those with diabetes, depends on seasonality [22,23]. Studies reveal a statistically significant difference between the activity of mitochondria isolated from rats in autumn (October-November) and those in spring (April- May). Until now, few studies have taken the impact of this seasonal variation into account when studying changes in cells or tissue at the molecular level. It has been demonstrated that older rats (5-6-month old) might be more sensitive to seasonal influences than younger rats (4-month old) [24]. The authors indicate that male laboratory rats exhibit seasonality in several reproductive parameters, even though the animals might be maintained under constant laboratory conditions. Hence, the impact of seasonal fluctuations on tested animal parameters needs to be taken into account in the planning of any such study.
In the present paper, the studied mitochondria were isolated from healthy and diabetic rats after different lengths of time. The first group of animals left the experiment in November (1 month after beginning treatment), the second in January (2.5 months) and the last in April (5 months). Surprisingly, no statistically significant changes were observed between mitochondria isolated from ‘healthy’ and ‘diabetic rats’ as well as between ‘diabetic rats’ and ‘diabetic rats supplemented with phenolic extract’ for each time-point. The changes were only observed for such mitochondrial parameters as: RCR, States 2-4, State E, and they were only dependent on time. The obtained results do not reflect the detrimental effect of diabetes on mitochondria activity but the ‘negative’ effect of time. However, in contrast to these results, mitochondria isolated during the spring (after 5 months) were not in a better, or at least similar, condition than the ones isolated in the autumn-winter period (after 1 and 2.5 months). It is possible that different seasonal conditions under which the animals were maintained during the course of the study affect the final interpretation. On the other hand, all markers of diabetes, i.e. the glucose or glycated hemoglobin concentrations, as well as loss of body weight, are characteristic of well-induced diabetes.
Wistar rats have been found to be more sensitive to STZ-induced diabetes than Sprague-Dawley rats. Also, although, we do not distinguish between these strains with regard to severity of diabetes (based on the values of “diabetic markers” of impaired metabolism), we have shown that heart mitochondria isolated from Sprague- Dawley rats appear more resistant to metabolic dysfunctions observed in STZ-diabetic animals compared to those isolated from Wistar rats. Therefore, Wistar rats seem to be a better choice as a model of diabetes in the study of hyperglycemia-induced alterations in mitochondrial bioenergetics [21,22]. Nevertheless, in other studies, the STZ-treated Sprague-Dawley rat is by far the most common model for the study of cardiac mitochondrial alterations induced by hyperglycemia [25,26].
Furthermore, it became apparent from other studies that cardiac mitochondrial appearance and function would be changed after STZtreatment. One of the basic parameters to evaluate mitochondrial function is the measurement of respiration rates, namely State 3 (oxygen consumed during ATP synthesis) and State 4 (oxygen consumption after complete ATP synthesis) respiration [27]. Again confirming the work done with isolated heart mitochondria, coupled and uncoupled (using dinitrophenol) cell respiration, measured polarographically in the presence of pyruvate and malate or succinate as oxidizable substrates was also decreased in the hyperglycemic group [28]. However, Remor et al., [29] observed that the different patterns of hyperglycemia-induced changes in OXPHOS depend on tissue analysis. They examined mitochondrial bioenergetics in liver, kidneys, skeletal muscle and heart of Wistar rats and showed that the changes in the tissue response on the same experimental protocol varied and strictly depended on the tissue [29].
The results of the present study show that the activity of respiratory chain complexes (II-V) was similar for hearts from healthy and diabetic animals, which implies that ‘diabetic’ hearts respire as ‘healthy’ rats. However, most studies report an increase in succinate-dependent mitochondrial respiration at Complex II site and inhibition of Complex IV activity in STZ-treated diabetic rats [26,30]. It is well documented that diabetes negatively affects cardiac mitochondrial bioenergetics [31,32]. It has also been shown that heart mitochondria isolated from rats treated with STZ 8 weeks earlier possessed depressed state 3 respiration and Mg2+-dependent ATPase activities [28]. However, some studies note that complex I rather than complex II is the rate-limiting enzyme in oxidative phosphorylation (OXPHOS) [33]. Therefore, any modification of the function of this complex could have a direct impact on the overall energy state of the cell. This is confirmed by Remor et al. (2011) who report a severe impairment of the energy metabolism in the peripheral tissues of hyperglycemic rats (Wistar rats). Complex I, II and IV activities in skeletal and cardiac muscles were significantly reduced after 30 days of hyperglycemia. Furthermore, the heart was found to be the most sensitive tissue to the diabetic condition, since the energy metabolism was impaired after 10 days of hyperglycemia [29].
The present paper reveals that only one mitochondrial parameter (RCR) was decreased, within the study group, and that this decrease was dependent on the duration of the experiment. Nevertheless, these results are in line with those of other studies, and it does not mean that lower mitochondrial activity is typical only for disease-induced changes. Lower mitochondrial function and content in the elderly could also be the result of a normal and ‘healthy’ aging process. It has been hypothesized that reduction of in vivo mitochondrial function, assessed on the basis of ATPase or PCr-t 1/2 and also ex vivo lower substrate-coupled ATP production (State 3 respiration) are due to increased mitochondrial uncoupling [34]. According to this concept, aging-related lowering of mitochondrial respiration resulting from mitochondrial uncoupling would serve to protect against the damaging effects of ROS [35,36]. Therefore, it is possible that a reduction in mitochondrial respiratory activity with time is a physiological adaptation to protection from aging, but not necessarily disease progression.
To verify the hypothesis that the extract can improve function of coronary vessels in diabetes we also monitored the coronary vessels function in the animals supplemented with the dose of 5 mg/ kg b.w./ day which was effective in increasing of the animals’ survival. According to the literature as well as to our own observations the coronary vascular function is compromised already in the 8th week of STZ diabetes in rats. Thus we had chosen to compare endothelial dependent and endothelial non-dependent responses in coronary vessels at three points of time from the onset of supplementation with the extract, namely 8, 14 and 20 weeks (data not shown). Contrary to our expectations we did not observe any effect of supplementation on most of the tested parameters. The only significant difference between the two groups was a slightly higher flow in the conditions of NOS inhibition in supplemented animals at the 20th week of observation. Such an effect could be possibly explained by an improvement in compensatory increase in activity of the vasodilatory mechanisms other than those mediated by NO.
5. Conclusion
In summary, plant extract administration does neither affect the heart mitochondrial respiratory capacity nor the heart coronary flow in Sprague-Dawley rats with long lasting STZ-induced diabetes. On the other hand, acute experimentally-induced diabetes did not alter mitochondrial bioenergetics regardless of whether the tested animal group comprised healthy or diabetic animals. However, some factors such as seasonal fluctuations, the choice to isolate mitochondria from a rat strain more resistant to STZ-diabetes induction or inappropriate experimental design may vastly contribute to obtaining misleading outcomes. Such factors reinforce the need for great care to be taken with experimental design, particularly when using animal models.
Hence, to better assess the influence of plant extracts in the prevention of mitochondrial dysfunction caused by long-term diabetes, there is a need to establish a good diabetes animal model and limit influence of seasonal changes. This continues to be an ongoing focus of research in our laboratory.
6. Conflict of Interest
The Authors declare no conflict of interest.
Author Contributions
Magdalena Labieniec-Watala
- Contribution to study design.
- Participation in the methodological design and protocol evaluations, with relation to some experiments presented in this paper (mitochondrial bioenergetics studies).
- Supervision and conducting of the in vivo study.
- Data analysis, including statistical analysis (for data presented in: Fig. 2-4, Tables 3-6).
- Contribution to the manuscript writing (Abstract; Introduction; Material and Methods: Chemicals, Animals and husbandry, Induction of STZ-diabetes in rats, Groups and treatment, Blood collection and glycated hemoglobin level determination, Isolation of rat heart mitochondria; Statistical analysis; Results: Effect of spent hop extract on body weight, glucose level, HbA1c level, mitochondrial function; Discussion).
Tomasz Przygodzki
- Contribution to study design.
- Supervision and conducting of the in vivo study (also the survival experiment mentioned in this paper).
- Data analysis, including statistical analysis (for data presented in: Figure 5-6).
- Contribution to the manuscript writing (Material and Methods: Langendorff measurements; Results: Effect of spent hop extract on coronary flow; Discussion: the part concerning the impact of tested extract on coronary flow measurements).
Karolina Siewiera
- Participation in the method and protocol evaluations, with relation to mitochondria measurements.
- Contribution to the collection of data (blood collection, glycated hemoglobin measurements; rat hearts isolations).
- Experimental work with animals (anesthesia, etc.).
- Critical correction of the manuscript.
Anna Podsedek
- Participation in the method and protocol evaluations, with relation to hop spent extract isolation and purification.
- Data analysis (for data presented in: Figure 1)
- Preparation of: Figure 1 and Tables 1-2
- Contribution to the manuscript writing (Material and Methods: Chemicals, Plant material and extract preparation, Basic constituent analysis, Quantification of phenolic compounds by spectrophotometric methods, Identyfication of polypehnols …; Results: Chemical identification..;).
Cezary Watala
- Contribution to the project and study design.
- Contribution to writing of the manuscript (all sections of this manuscript) and the critical correction of the manuscript.