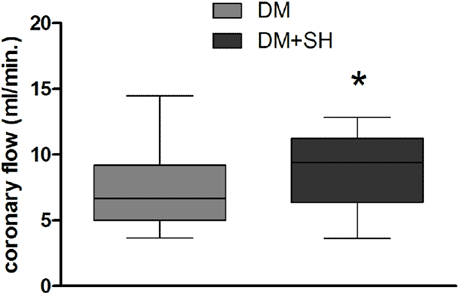
Figure 6: Coronary flow in response to L-NAME in the hearts isolated from diabetic animals (light grey, DM) and diabetic rats supplemented with spent hop extract (dark grey, DM+SH) presented at the 20th week of observation.
Data are given as median with interquartile range (boxes) and minimal and maximal data ranges (whiskers), n=9-11 animals, *P<0.05. For experimental details see ‘Materials and methods’.
Data are given as median with interquartile range (boxes) and minimal and maximal data ranges (whiskers), n=9-11 animals, *P<0.05. For experimental details see ‘Materials and methods’.