


1. Introduction
Diabetes Mellitus (T2DM) has reached epidemic proportions worldwide due to the economic growth, over nutrition and obesity factors [1]. The Western dietary pattern was associated with an elevated risk, whereas the grains-vegetables dietary pattern was associated with a reduced risk of T2 DM among middle aged Chinese adults [2]. Older adults with diabetes are at risk of developing spectrum of macrovascular and microvascular complications as their younger counterparts with diabetes [3]. Other risk factors include obesity and a sedentary lifestyle, which play important roles in escalating the prevalence of diabetes [4]; in particular, obesity at a young age [5]. Advanced glycation end products (AGEs) derived from food increase reactive oxygen species formation and impair antioxidant systems, and they have been assumed as risk factors for T2DM [6,7]. AGE derived from protein–carbonyl reactions or advanced lipoxidation end products (ALEs) contribute especially in diabetic patients to a significant accumulation of AGEs/ALEs in the tissues [8]. In the United States, the consumption of high fructose corn syrup (HFCS) increased > 1000% between 1970 and 1990, far exceeding the changes in intake of any other food or food group [9]. HFCS is the major source of caloric sweeteners in soft drinks and many other sweetened beverages and its regular intake is implicated in numerous other foods [10]. Glycated hemoglobin [HbA1c], which is deeply involved in T2 DM is the most well studied example of AGE [11].
With systemic insulin resistance, insulin signaling within glucose recipient tissues is defective and beta cell dysfunction results from inadequate glucose sensing elevated blood glucose concentrations [12] , which accelerate aging [13]. Hyperglycemia is suggested to be the main cause of diabetic complications, decrease life quality and expectancy, and becomes a financial burden for health care systems [6]. The underlying mechanisms of T2 DM lies on the condition of oxidative stress, due to free radical over production and decreased antioxidant defences [14] and also to defects in the dentate gyrus of the hippocampus [15]. Positive association exists between glucose levels and diabetic microvascular complications particularly diabetic retinopathy [16].
The serum C-peptide (31-amino-acid residues) is produced in equal amount with that of insulin cleaved from proinsulin [17] with longer degradation rate in the body with the half-life of 20-30 min) compared with that of insulin (3-5 min) and measurement of C-peptide levels in insulin-treated diabetics avoids the problems of cross-reaction of assay between exogenous and endogenous insulin. Fasting plasma concentration of C-peptide among normals range between 0.3-0.6 nmol/l, with a postprandial increase to 1-3 nmol/l and its concentration is associated with duration and comorbidities of disease [18]. Retinol binding protein -4 (RBP4) has recently gained a lot of attention because it is a novel adipokine predominantly secreted by adipocytes from visceral adipose tissue and its level is elevated in diabetic patients compared with healthy subjects correlated positively with triglyceride, systolic blood pressure [19].
The longer diabetes has been present, the more likely patients are to require insulin to control their hyperglycemia and hyperglycemia in these patients is often not well controlled and effective clinical management is problematic. Food antioxidants with scavenging ability serve as a defense system against the oxidative stress may play a protective role in initiating intervention for primary and second prevention of T2 DM.
Tomatoes lycopene has unique biological properties by exhibiting a physical quenching rate constant with singlet oxygen and clinical evidence supports its important health benefits [20]. Drinking two glasses of tomato juice; providing daily roughly 40 mg of lycopene inhibited platelet aggregation in patients with T2 DM [21]. The increase in the plasma level of lycopene following the drinking of tomato juice is a valid biomarker implying good management and reflecting lowering in the oxidative stress among the study subjects.
Carotenoids demonstrate vital biological roles in the eye, both functionally as precursors to retinol in the visual pathway (provitamin A (PVA carotenoids) and structurally as macular pigments. Lycopene is present in high concentrations in the human retinal pigment epithelium choroid [22] and the combined plasma lycopene and lutein/zeaxanthin (non-pro-vitamin A (non-PVA) carotenoid) concentration was significantly lower in the T2 DM retinopathy than non-retinopathy group [23] compared with the pro-vitamin A (PVA) carotenoids (α-carotene, β-carotene and β-cryptoxanthin). Low molecular weight soluble fraction of tomato paste are also strong inhibitors against the formation of AGE [24].
The goal of the present study is to carry out laboratory investigations on Egyptian patients with long duration of type- 2 diabetes mellitus (T2DM) to obtain analytical data on 14 blood components and to examine their potential potency as dietary and health related biomarkers. The impact of dietary intervention with thermally treated tomato juice on the plasma level of lycopene is tested and elevated plasma levels were considered valid biomarker reflecting lowering in the oxidative stress among the study subjects.
2. Subjects
2.1 Eligibility and Enrollment
Twenty nine subjects (19 M, 10F) were recruited from the outpatient clinic of Kobry El Kobbah insurance hospital with complete data sets from all sessions. To be eligible, participants had to be ≥ 50 years, have diabetes mellitus (DM) and taking at least one anti-diabetic medication. Individuals were excluded if they had any major medical (eg, cancer, chronic liver disease, chronic kidney disease, hemodialysis, glucocorticoid treatment, pregnancy) or psychiatric disorders that would prevent full participation. The study received the approval from the Ethical Committee of Kobry El Kobbah insurance hospital, Cairo, which complied with the Declaration of Helsinki guidelines (2004). The protocol was fully explained to all subjects and written informed consent was obtained before their participation in the trial.
2.2 Data Collection
Demographic factors were assessed via a patient questionnaire. At baseline, a standard questionnaire concerning date of birth, sex, education, smoking habit, health-related information history and medications were obtained by face-to-face interviews. The investigator received extensive training specifically for this questionnaire. All subjects had a physical examination including measurement of height and weight. Body mass index (BMI) was calculated as weight (kg) divided by the square of height in meters (m2). Blood pressure was measured on the right arm three times consecutively at 1-min intervals, with the mean of the three measurements used for analysis.
2.3 Design of the dietary intervention randomized controlled trial
The participants were divided into two groups, whereby one arm served as control group and didn’t receive any supplement; while the second group was assigned to the tomato juice. Each participant took 7 tomato juice bottles back home once a week, and the process was repeated on three consecutive weeks. The participants were instructed not to alter their usual diet and not to change the dosage of insulin or the oral glucose lowering drugs and to adhere to the following protocol. To keep the bottles frozen at -200C except the bottle they drank the following day.
2.4 Thermally treated tomato juice with added corn oil
Ripe large size full color tomatoes were purchased as a single batch. After cleaning, washing and homogenizing in a Waring blender, the resulting juice was poured in a 100 liter capacity porcelain- lined reactor adapted with mechanical stirrer and thermostat (Pilot plant - NRC, Egypt). The tomato juice was heated to 750C with live steam and the temperature was stabilized for 20 minutes, then cooling started. When the temperature reached 450C, maize oil was added to the juice under mechanical stirring to 4 % final concentration (w/w). Upon cooling, the tomato juice was packed in 240 ml aliquots in polyethylene container with air tight cover and saved frozen in a deep freezer at -200C.
2.5 Laboratory investigations
2.5.1 Blood sampling
The participants were asked to come to the clinic in the morning after at least 8 h of overnight fasting and before taking any drug at day zero (baseline data) and day 22 (The last day of intervention). Standard clinical venipuncture methods were used for the blood sampling without anticoagulants to determine glucose concentrations. The blood samples were centrifuged and serum supernatant fractions were stored frozen at -30° C for the analysis of serum lipid profile and C-peptide. A blood aliquot was transferred to a heparinized tube and immediately centrifuged and the plasma was stored frozen at -30°C for the determination of plasma carotenoids and retinol.
2.5.2 Laboratory investigations
Fasting and 2h post prandial (after the 75 g oral glucose tolerance test) blood glucose were measured by the hexokinase method with a Boehringer Mannheim Hitachi kit. Glycosylated hemoglobin was measured on micro-column (Bio-Rad). Serum total cholesterol (Cat No CH 200), triglyceride (Cat No TR 1575) and HDL-cholesterol (HDL-C) was assayed after precipitation of the apo β-containing lipoproteins with phosphotungstic acid and magnesium ions with commercial kit (Biodiagnostics, Egypt). Measurements were done by the enzymatic colorimetric endpoint assays according to the instruction of the Kit’s manufacturer. The performance of these assays was regularly certified by reference plasma samples. The Friedewald equation [25] was used for calculating plasma LDL-cholesterol.
Plasma LDL-C (mmol/l ) = TC (mmol/l) – ((HDL-C mmol/ l + TG mmol/l /5)
The level of serum C-reactive protein was assessed by the latex method. Plasma C- peptide was assayed by immune assay method (Roche kit, Catalog Number: 03184897190) on Cobase 411 analyzer according to instruction of the manufacturer.
2.6 HPLC separation of plasma carotenoids
Plasma carotenoids were measured within few weeks from the date of blood collection and β-carotene has been shown to be stable at -350C up to 22 mo [26]. The two plasma samples for each subject (baseline and sample collected after 3 weeks intake of tomato juice) were analyzed on the same day. The plasma was thawed and aliquots of 460 μl were pippeted in a 2.2-ml Eppendorf centrifuge tubes. Additions of 100 μl of Apo-β-carotenal as internal standard, 460 μl absolute ethanol (containing 1 mg ascorbic acid/mL) and 900 μl of n-hexane (containing 0.1% butylated hydroxytoluene/ mL) were done in this sequence. After vigorous vortexing and centrifugation (Biofuge-Fresco, Heraues, Germany), the upper layer was aspirated, and the extraction was repeated twice. The pooled hexane supernatant was evaporated to dryness under nitrogen at 400C and the residue was resuspended in 100 μl of the mobile phase.
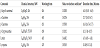
The chromatographic system consisted of HPLC instrument equipped with pump 600 and controller 600 (Waters Associates, Milford, MA). The analytical column consisted of a 4.6x 250 mm column (GI Sciences, Japan) packed with Inertsil ODS, 5 μm and 100 % isocratic mobile phase consisting of acetonitrile-dichloromethane -methanol (70:20:10 v/v) at a flow rate of 1ml/min. A Waters model multichannel photodiode detector was used to monitor absorbance at 450 nm. Lutein and zeaxanthin were not separable and are reported together as lutein, because lutein is usually present in larger concentrations than zeaxanthin. Calibration was performed with pure compounds of α-; β- carotenes; lycopene, β-cryptoxanthin and lutein [Sigma -Aldrich]. Standard β-carotene, the internal standard apo-β- carotenal (Fluka) were prepared by dissolving in the recommended solvent. The concentrations of the standards was determined by visible spectrophotometry. Because the standard α-carotene was not available, this compound was quantified by using the response factor for the all-trans β- carotene isomer. The lutein, β-apo-8-carotenal, β-cryptothanthin, lycopene, α-Carotene and β- carotene peaks appeared at retention times of 4.3 ; 6.26; 8.2, 10.49, 15.7; 16.8 minutes, respectively (Table 1). The column was rinsed for additional 5 min with the mobile phase before the injection of the next sample; 21 min were elapsed between two consecutive injections. The carotenoid concentration was determined by the external standard curve procedure. The peak areas of the unknown samples were integrated and the results were compared with the respective peak areas of the carotenoid standard having the same retention time. These peak areas were used to create the calibration graph and to calculate the regression coefficients.
2.7 Separation of retinol by HPLC technique [29]
Eppendorf tubes containing aliquots of 150 μl plasma and 50 μl of the internal standard retinyl acetate were mixed with equal volume of acidic propanol to denature the proteins, followed by extraction with hexane (1 ml). Following vigorous vortexing and centrifugation, aliquots of the clear hexane layer (850 μl) were aspirated and saved in glass tubes in dim light. The extraction process was repeated and the supernatants were pooled. The hexane extract was evaporated under a stream of nitrogen and reconstituted in 200 μl methanol under vortexing for complete dissolution.
HPLC separation: The same HPLC system mentioned above was used for the separation of plasma retinol [29]. The gradient for the mobile phase was acetonitrile, water and aqueous acetic acid (2%) at a ratio of 85: 13: 2. Aliquots of the sample and standard extracts (20 μl) were manually injected with a flow rate of 1.5 ml / min and the monitoring wave length was 325 nm. Signals from the Waters 996 photodiode array detector was recorded simultaneously by the data system. Plasma retinol concentration was determined by the internal standard curve method, and calculations were done using Ezchrom chromatography data system version 2.1. The preparation of standard curve and the quality control were carried out as reported earlier [29].
Quantitative assay of retinol binding protein (RBP-4) by Western blotting technique Immuno detection was performed with a polyclonal full-length recombinant RBP4 antibody to human RBP4 (Dako Cytomation). Analysis of tomato juice for carotenoid pigments.
The carotenoid content of the tomato juice was determined after extensive extraction of the juice with tetrahydrofuran/methanol (1:1, v/v) until the last extract was colorless (usually five times extractions). An aliquot was taken and the compound ethyl-β-apo-carotenoate was added as an internal standard. HPLC separation was completed on a column packed with ET 200/4 nucleosil 100–5CN (Machery& Nagel, Duren, Germany).
2.8 Composition of the mobile phase for gradient elution
| Time (Min) | Heptane (v/v %) | Isopropanol (v/v %) |
| 0-3 | 97 | 2.5 |
| 3-15 | 50 | 50 |
| 16-30 | 97 | 2.5 |
At a flow rate of 1.0 mL/min and column temperature of 20°C. The eluent was monitored by visible detection at 450 nm for β-carotene and at 470 nm for lycopene. In this system, α-carotene co-elutes with β –carotene, but tomato doesn’t contain α -carotene [30], the HPLC response with retention time of 14–17 minutes was practically β -carotene.
2.9 Statistical analysis
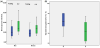
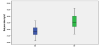
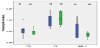
The results are expressed as means ±SE. Whisker box plots were plotted to investigate the the variability in the blood glucose concentrations, body mass index and the serum lipid profiles and plasma lycopene according to sex. At the completion of the three week dietary intervention study each treated individual was compared with the respective pre feeding (baseline) level. The paired t- test was used to analyze normally distributed data. Nonparametric statistical tests were performed and significance was accepted if the null hypothesis was rejected at the P< 0.05 level. Statistical analysis was performed with the Microsoft exel statistical software.
3. Result
Table (2) presents the baseline characteristics of the diabetic men and women whose average age were 61 and 62 years, respectively. Duration of diabetes averaged 11.6 years (5-25 years). Based on the BMI data (BMI > 30 kg/m2), a 33.3% and 87.5% of the diabetic men and women were obese. 84% of the diabetic men received daily insulin injection versus 33.3% of the diabetic women; the rest i.e. 16 % of the diabetic men and 66.7% of the diabetic women were treated with oral therapy.
The fasting blood glucose (FPG) levels (≤7 mmol/l) [31] was acceptable among 46.7% and 40% of the diabetic men and women, respectively.
The standard acceptable glycemic index is equivalent to HbA1c level ≤ 6.5 % and only 7% of the diabetic men and 44 % of the diabetic women satisfied this criteria; the glycemic index of a higher proportion of the diabetic women was better controlled than that of the diabetic men (Chi square test = 4.48; P< 0.05).
When the glycemic index (HbA1c) for diabetics was set at 9%; 78.6 % and 88.9% of the diabetic men and women, respectively fell within this figure.
FPG is the gold standard and it correlates positively and significantly with HbA1c r = 0.5321 (P<0.01) and r = 0.9534 (P<0.001) for diabetic men and women, respectively. The respective regression equations are ȳ Predicted fasting glucose concentration among diabetic men = 1.26 x + 0.1025; ȳ Predicted fasting glucose concentration among diabetic women = 2.12 x - 6.26.
The plasma lipid profiles are characterized by hypertriglyceridemia i.e above upper normal limit of plasma triglyceride (1.7 mmoles/l) among 69.2 and 60 % of the diabetic men and women, respectively. Acceptable serum HDL-C of 58% and 60% were found among diabetic men (>1.09mmol/l) and women (1.3mmol/l), respectively. Serum triglycerides correlated negatively with serum HDL-C only among the diabetic men with correlation coefficient of -0.4607 (P<0.01). Whisker box plot illustrates the concentrations of serum triglyceride, total cholesterol and high density lipoprotein cholesterol among the diabetic men and women.
Metabolic syndrome (MS) The criterion used for defining MS are the followings: Waist circumference (cm) <94 (male); <80 (females); Glucose (mmol/L) <5.6; HDL cholesterol (mmol/L) ≥1.03 (male); >1.29 (females); Triglycerides (mmol/L) ≤1.7; Systolic pressure (mm Hg) <130; Diastolic pressure (mm Hg) <85 [32]. Based on the above mentioned criterion, MS was found among 22.2% of diabetic women and 8.0% among the men and Chi square test revealed statistical significant differences (P<0.05).
Serum C- peptide levels averaged 1.3 nmoles/l, with no differences between sexes. Acceptable levels were found among all participants, except for two hyperglycemic diabetic women whose serum C-peptide levels were <0.2 nmol/l. Such low serum C-peptide level reflects absolute insulin deficiency/absolute insulin requirement [33,34] Serum C -peptide correlated negatively and significantly with FPG r =-0.3086 (P< 0.05) and women r = -0.6959 (P<0.1) among diabetic men and women, respectively.
3.1 Plasma carotenoids and retinol
A representative HPLC chromatogram demonstrates the separation of the 5 major carotenoids and the internal standard from the authentic carotenoids and a plasma extract of a participant. The retention times of lutein; internal standard β-apo-8-carotenal; β- cryptoxanthin; lycopene; α carotene and β- carotene were 4.3; 6.26; 8.2; 10.49; 15.7 and 16.8 minutes respectively.
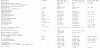
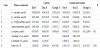
Table 2 presents baseline level of plasma carotenoid concentrations among the diabetic men and women. The mean concentrations of α, β- carotene, cryptoxanthin and lycopene were higher among the diabetic women than the respective mean values of the men; however, only mean serum β-carotene concentration attained significant differences (P<0.05).
3.2 The composition of the thermally treated tomato juice
The analysis of the thermally treated tomato juice is presented in Table 3. The daily portion of 240 ml provided 22.3 mg lycopene, 1.32 mg ß-carotene and 26 mg total polyphenolic compounds.
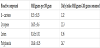
Table 4 presents the mean plasma α, β-carotene, cryptoxanzin, lutein and lycopene among the diabetics at the start and end of the 3 week dietary intervention.
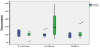
At the end of the 3 week intake of tomato juice, the mean change in the plasma lycopene concentration increased by 161 % compared to the respective prefeeding level (Figure 4).
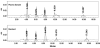
The consumption of tomato juice was also associated with % increase in the mean concentrations of α-, β-carotenes and lutein. Mean plasma β- cryptoxanthin concentration decreased following the consumption of tomato juice. The ratio of combined plasma lycopene and lutein/zeaxanthin (non-pro-vitamin A (non-PVA) carotenoid) concentration to the pro-vitamin A (PVA) carotenoids (α-carotene, β-carotene and β-cryptoxanthin increased slightly following the 3 week dietary intervention with tomato juice, relative to the respective prefeeding mean level, but the difference didn’t reach significant value (P>0.05).
Mean serum retinol levels among the diabetic men and women were above the cutoff point of 0.7 μmoles per liter; however 13 % of the men were biochemically deficient in plasma retinol (> 0.5 and < 0.7 μmoles per liter). Prevalence of smokers was 13 % among diabetic men , but smoking habits had no effect on the serum retinol level. Initial plasma retinol concentrations among the females correlated inversely with glycosylated hemoglobin [r = -0.4212; P<0.01] with a regression equation of Y= 1.882 - 0.0809 X (Y= Predicted plasma retinol concentration; X= glycosylated hemoglobin).
Identical initial mean serum RBP-4 concentrations of 31.8± 0.9 and 32.9 ± 1.1μg/ml (equivalent to 1.5±0.04 μmoles/l and 1.57± 0.05 μmoles/l) were obtained among the diabetic men and women, respectively. Respective mean molar ratios of retinol: RBP- 4 were 1.4 ± 0.18 and 1.41± 0.17. The molar RBP-4: retinol ratio correlated negatively with body mass index of the men and women with correlation coefficients of - 0.23 and - 0.66 (P<0.01) respectively. Fasting plasma glucose among diabetic men correlated positively with post prandial glucose, HbA1C, duration of diabetes and systolic blood pressure.
4. Discussion
It is estimated that 20% (18 -33%) of the aging population have T2DM and another 30% of old people have impaired glucose regulation which means an increased risk for DM [35]. Population growth, aging of population and urbanization with associated lifestyle change is likely to lead to a 55% increase in worldwide numbers with diabetes by 2035 [36]. In Egypt population over 60 years represent 4 % of the 100 million population estimate. Accordingly, roughly 800000 Egyptians over 60 years are suffering from T2DM. The present results highlight the burden of poorly controlled diabetes with co-existing morbidities and lower ratings of their overall health and limited access to specialty care to address multi-complex management needs. Metabolic syndrome (MS) contributes to increasing risk of developing cardiovascular disease [37]. Similar metabolic disorders and comorbidities were reported for diabetics from Canada [38], China [39], Hawai [40] and Malaysia [41]. Treatment for diabetics consists of reducing hyperglycemia through diet, exercise, and therapy with drugs or insulin. Despite insulin treatment, hyperglycemia in these patients is often not well controlled and effective clinical management is problematic. Oxidative stress, due to free radical over production has been implicated in the pathogenesis of DM and to pancreatic β-cell dysfunction [4]. Identifying individuals with abnormal glucose regulation enables intensified preventive measures to be undertaken earlier and at effective cost [31]. DM was defined as FPG ≥ 7.0 μ mol/L [42]. In 2009, the American Diabetes Association [43] recommended using a threshold of HbA1c ≥ 6.5% to diagnose diabetes. Glycated hemoglobin (HbA1c) is an important glycemic index that indicates average blood glucose levels over the previous 3-4 months. HbA1c tests are convenient and can be performed at any time regardless of the time of the previous meal [44]. Some studies had demonstrated that combined use of FPG and HbA1c are necessary [45].
The high significant correlation coefficients between FPG and HbA1c of 0.5321 and 0.9151 among the diabetic men and women, respectively agrees with earlier reports [46]. HbA1c, diabetes duration and diastolic pressure are significantly related to a higher risk of developing metabolic syndrome [47].
A prospective cardiovascular study carried out on middle-aged Canadian men showed that reduced plasma HDL-cholesterol concentrations have a greater impact than raised LDL-cholesterol on the atherogenic index (total cholesterol/ HDL-cholesterol ratio) [38], and the authors considered raising plasma HDL-cholesterol through a healthy diet, and proper pharmacotherapy is a target for the optimal prevention of CHD in a large proportion of high risk patients.
Lycopene (80–90%) the predominant carotenoid pigment responsible for the red colour in tomatoes is an aliphatic hydrocarbon (C40H56) with 13 double bonds; 11 of them being conjugated. It exhibits the highest physical quenching rate constant with singlet oxygen, implicated in the defense against prooxidant state [48]. Interest in lycopene was firstly focused on its antioxidant properties, however their beneficial effects are related also to other mechanisms, such as immune system, inflammation response [49,50] and regulatory molecules associated with cell proliferation, and by contributing to intracellular signaling [51,52]. Serum and tissue lycopene are validated biomarkers for the exposure to tomato intake and its significant increase in the plasma suggests possible protective roles in reducing risk of progression of DM pathogenesis, improving glycemic control in patients who had poorly controlled type II diabetes despite therapy with insulin or with oral drugs. Significant linear decrease in lycopene was reported in Americans with newly diagnosed diabetes [53] and all the carotenoids were inversely related to fasting insulin concentration. Variation of serum carotenoid concentrations were attributed to impaired glucose tolerance or diabetes which impaired the absorption of various carotenoids from the intestinal lumen.
Between 79–91% of the lycopene found in raw tomatoes is in the all-trans- form [54,55]and the mild cooking and steaming of tomato juice has dramatic positive effect on the disruption of cells and converting lycopene to the Cis-isomer [56,57]. Eating concentrated tomato-based foods like pasta sauce with Cis-isomers of lycopene are better absorbed than their all-trans parent structure due to greater solubility of cis-isomers in mixed micelles and a lower tendency to aggregate [56,58]. 50-90% of serum and tissue lycopene are in cislycopene isomers [56,59].
The mean baseline plasma lycopene concentrations 0.42±0.06 μmol/L among diabetic men and 0.8± 0.2 μmol /L among diabetic women; the last figure is quite overlapping with the respective figure of 0.75 reported among patients with mean diabetes duration of 23 years, and HbA1c of 8.5% [60]. The lower levels of plasma provitamin A carotenoids and retinol among men compared to women was attributed to higher vitamin A requirements in men [61]. Race or gender differences about the serum levels of carotenoids and associations with the risk for developing T2 DM had been reported [62].
In the present study tomato juice was subjected to thermal treatment using live steam as recommended earlier [63] to convert the all-trans lycopene to the cis- form.
The tomato lycopene (14.85 mg/100g ) and β-carotene (0.53 mg/100g) contents overlapped the respective levels of 0.86-14.62 mg per 100 g tomato grown in Europe [64]. In the present study, the magnitude of the change in the plasma lycopene concentration ranged from 73 to 290 % the respective baseline level with average fold excess of 162 ± 30% (P < 0.1) following three week intakes of 240 ml thermally treated tomato juice providing 22 mg lycopene daily. High inter individual variation is evident and is in line with previous findings [65]. Serum lycopene levels showed the highest ratio for intra- to inter individual variation of 0.57; compared with other serum carotenoids and 7 serum measurements of lycopene are required to reach the 10% cutoff [65]. Significant diet serum lycopene correlation averaged 0.50 [66]. Adipose tissue lycopene concentration reflect storage depot levels and was inversely associated with risk for myocardial infarction [67]. Consuming about 200g of raw tomatoes daily for 8 weeks successfully lowered both systolic and diastolic blood pressure in diabetics due to a reduction in activity of angiotensin converting enzyme (ACE), an effect produced by common antihypertensive drugs [68]. Daily consumption of two glasses of tomato juice providing 40 mg of lycopene substantially reduced low density lipoprotein (LDL) oxidation; a signature for risk of atherosclerosis and coronary heart disease. Another study demonstrated that consuming a lycopene-rich Mediterranean diet increased serum lycopene levels and reduced the concentration of HbA1c from 7.1 to 6.8% [69]. The lycopene concentration increased (0.34 to 0.52 μmol/l) significantly in the plasma of Italian female adults after consuming tomato products providing 8mg lycopene per day for three weeks with associated 20% mean decrease in lymphocyte malondialdehyde levels [70].
Daily consumption of 12.5 mg lycopene comprised in tomatoes (145-320 g), tomato juice (94-100g) or in puree (25-28 g) for 4 weeks increased the concentration of lycopene from 0.25 μmol/L at baseline to comparable values ranging between 0.53-0.81 μmol/L for the 3 groups [71].
Supplementation with cooked tomatoes for a period of 30 days decreased lipid peroxidation rate (p<0.001) in diabetic patients [72]. Another group of investigators showed that the daily intake of 30 mg of lycopene by older diabetic women reduced total and LDL cholesterol by 12 and 16% respectively, and also lowered common marker of tissue oxidation that contributes to atherosclerosis [73]. The available clinical research and systematic analysis obtained from 13 different randomized controlled trials (RCTs) demonstrated superiority of whole food tomato lycopene versus lycopene supplement on cardiovascular risk factors [74,75]. Because tomato are chemically complex food wit potential beneficial substances including lycopene and other carotenoids; antioxidant vitamins and flavonoids, it is difficult to pinpoint any single nutrient that contributes the most to the protective effects.
5. Strengths and Limitation
The intake of thermally treated tomato juice increased the plasma lycopene by 162% compared to the respective prefeeding levels reflecting lowering in the oxidative stress and improving glycemic control among patients with (T2DM). Further studies are warranted to examine factors associated with the lower absorption rate of lycopene. The small sample size (N = 29) is the major limitation of the study leading to low statistical power and confidence intervals that may be difficult to interpret. A population-based study is warranted to highlight the association between the increase in plasma lycopene level and measures that could help prevent dysglycemia and dyslipidaemia with their negative sequelaes.
6. Conclusion
Pronounced health effects of the antioxidant-rich tomato lycopene can be used safely as an adjunct to glucose-lowering drugs in diabetics with poorly glycaemic control.
Competing Interests
The authors declare that they have no competing interests.
Acknowledgments
This work was supported by the Egyptian Italian Scientific Agreement (contract Bioscience # 11). The authors are thankful to Dr Mahmoud Ali-Department of Nutrition, National research center, Egypt, who kindly carried out the assay of serum C- peptide. The authors are grateful to all participants and to the physicians.