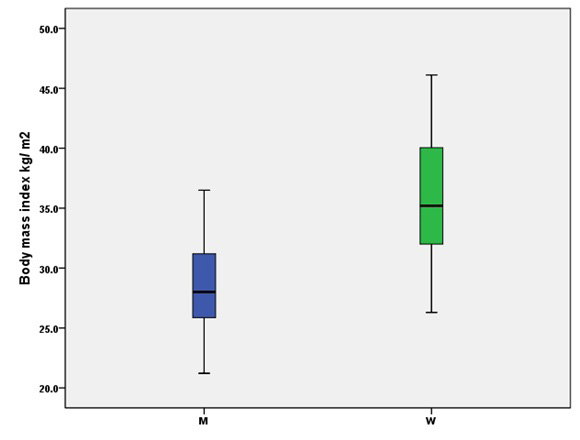
Figure 2:
Body mass index (BMI) among diabetic men and women Boxes represent the interquartile range (IQR) and the line inside represents the median. Whiskers denote the lowest and highest values.