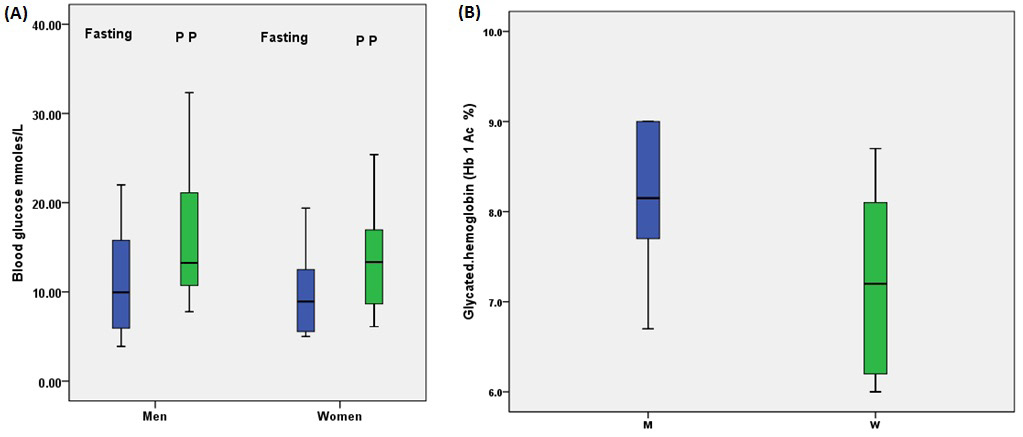
Figure 1: (A) Fasting and post prandial plasma glucose levels (B) Glycated hemoglobin (HbA1c) concentrations among diabetic men and women. Boxes represent the interquartile range (IQR) and the line inside represents the median. Whiskers denote the lowest and highest values.