


1. Introduction
The recommendations and evidence for intake of sugars have included both qualitative and quantitative recommendations that focus on limiting and reducing total sugar consumption, but especially added sugars consumption. Recommendations for intakes of added sugars have varied considerably and the scientific basis supporting these recommendations has been inconsistent [1,2]. The 1980 Dietary Guidelines for Americans (DGA) included the advice to “avoid too much sugar [3].” This was later quantified in 2002 with the release of the Dietary Reference Intakes (DRI) by the Institute of Medicine (IOM) (currently the National Academy of Medicine) [4]. The IOM committee reported on the association between added sugars and specific nutrient intakes at every fifth percentile of added sugars intake based on data from the National Health and Nutrition Examination Survey (NHANES) III 1988-1994 [5]. The data showed a drop off in intake of selected micronutrients at approximately 25% of energy coming from added sugars. Therefore, their recommendation to keep added sugars intake below 25% of energy was based primarily on micronutrient dilution; not whether people consuming added sugars consumed more kilocalories than required to meet their energy needs or had adverse health effects. This recommendation and rationale was used in both the 2005 [6] and 2010 Dietary Guidelines Advisory Committee (DGAC) reports [7]. In 2015 DGAC report, the scientific rationale to limit added sugars intake shifted to the association with health outcomes. The 2015 DGAC recommendation [8] was a maximum of 10% of total daily energy should come from added sugars. This was based, in part, on the reported strong and consistent evidence that intake of added sugars was associated with excess body weight in children and the development of dental caries and moderate evidence with increased risk of hypertension, stroke, and coronary heart disease in adults. The 2015 DGAC recommendation [8] is consistent with the World Health Organization 2015 report on sugars intake for adults and children [9].
The scientific basis of the evolution of recommendations for total sugar intake has been reviewed systematically with the conclusion being that based on the lack of high quality evidence there seems to be no consistent evidence that any recommended daily sugar intake thresholds were strongly associated with negative health effects [1,2,10]. One review questioned whether the current recommendation for intakes of added sugars[8] were science-based, too restrictive, or even achievable [11]. As such, “the appropriate limit of added sugars consumption” [10] is unknown, and there is no high quality evidence to definitively define the level of added sugars intake that has adverse effects. While there have been a number of review articles on intakes of added sugars and micronutrient dilution [12-14], these studies are outdated and thus a more recent investigation is warranted. The primary objective of this study was to update the association of usual intake (UI) of added sugars on nutrient adequacy in the US population using more recent national data (NHANES 2009-2012) [15,16].
2. Methods
2.1 Study overview, population and analytic sample
Data from NHANES 2009-2012, a cross-sectional study, were used for these analyses. An overview of NHANES, including the purpose, study population, sampling strategy, interview and physical examination procedures and response rates has been published on line [15,16]. In this study, data from children two to 18 years of age (years) and adults 19+ years participating in the two recent cycles of NHANES (2009–2012) were used to increase sample size [17,18]. Those with unreliable dietary records, as judged by National Center for Health Statistics staff (n =142), and pregnant or lactating females (n =170) were excluded from the study. The final analytic sample consisted of 6,111 children (2-18 years) and 10,698 adults (19+ years). Stringent protocols and procedures enforced by NHANES ensure confidentiality and protect individual participants [19]. As this was a secondary data analysis which lacked personal identifiers, this study did not require further institutional review.
2.2 Dietary Intake assessment
Dietary intake data were obtained from 24-hour dietary recall interviews using an Automated Multiple-Pass Method [20] which has been previously described [21-23]. Two 24-hour dietary recalls were collected: the first recall was in person in the Mobile Examination Center and the second recall was over the telephone. Caretakers of children 2 to 5 years provided the 24-hour dietary recalls for their children; children 6 to 11 years were assisted by an adult, older children and adults provided their own recall. Energy and nutrient intakes were calculated using the Food and Nutrient Database for Dietary Studies versions for NHANES 2009-2010 [24] and 2011-2012 [25]. The micronutrients studied were those with an Estimated Average Requirement (EAR): 10 vitamins (vitamins A, C, D, E, B6, B12, thiamin (B1), riboflavin (B2), folate (B9), niacin (B3), and 7 minerals (calcium, copper, iron, magnesium, phosphorus, selenium, and zinc). Added sugars were defined by United States Department of Agriculture as all caloric sweeteners that were eaten separately or used as ingredients in processed or prepared foods and was obtained from the Food Patterns Equivalents Database for each NHANES release [26].
The National Cancer Institute (NCI) (version 2.1, June, 2015) [27,28] usual intake (UI) programs were used for the estimation of the individual UI (estimated long term mean intakes) for energy and nutrients of interest. Given that energy and most nutrients are typically consumed almost every day, only the amount portion of the NCI program was used (thus probability of consumption component of NCI program was not used). The NCI method allows for a Box- Cox transformation of the nutrient/food intake to account for nonnormality and uses a measurement error model with covariates using a within subject and a between subject error structure. The measurement error model contained covariates for weekend (Friday- Sunday) versus weekday (Monday-Thursday) of recall, recall day sequence (day 1 or day 2) and age groups. A linear model was fit and a linear predictor was obtained for each subject. The equation for the expected UI for each subject was evaluated by obtaining the empirical Bayes estimate for the subject expectation as a ratio of integrals that was developed using adaptive Gaussian quadrature. Further details and a user’s guide can be obtained at the NCI website [27]. The percentage of energy from added sugars calculated as individual UI of energy from added sugars divided by individual UI of total energy times 100 was used to classify subjects into groups with varying levels of added sugars in the diet. Using individual UI, subjects within each age group, 2-18 and 19+ years, were separated into six groups: 0<5, 5 to <10, 10 to<15, 15 to <20, 20 to <25, and ≥25% of energy as added sugars. To assess the extent of inadequate intake of nutrients with an EAR, the EAR cut-point method was used (except for iron where the probability method was used) [29]. The EAR is the appropriate DRI to use when assessing the nutrient adequacy of group intakes [29]. This method provides an estimate of the proportion of individuals in the group with inadequate intakes by age and gender.
2.3 Statistical analyses
Beta coefficients were generated from linear models regressing percentage of the population below the EAR on UI of added sugars as a percentage of energy which measured the direction and magnitude of the association between the percentages of the population below the EAR as UI of added sugars as the percentage of calories from added sugars increased. To help assess whether there was a break point of where added sugars as a percentage of energy was associated with nutrient adequacy, two additional regression analyses were generated dropping the highest levels of intake (i.e., only using five levels of added sugars: 0<5, 5 to <10, 10 to<15, 15 to <20, and 20 to <25 of energy as added sugars and only using four levels of added sugars : 0<5, 5 to <10, 10 to<15, and 15 to <20 of energy as added sugars). In this way, an assessment of whether a significant relationship existed throughout the range of added sugars intake was evaluated. To account for multiple comparisons a Bonferroni correction was applied with a significance level set at p≤0.0029 (p≤0.05/17 nutrients examined). However, results with a less conservative significance level (i.e. p ≤0.01 or p ≤0.05) were also reported.
3. Results
3.1 Demographics
For children 2-18 years (Table 1), 50% were males, 55% non- Hispanic white, 14% non-Hispanic black, and 22% Hispanic. Mean age was 9.9 ± 0.1 years. The percent reporting vigorous physical activity decreased and the percent reporting to be current smokers increased with increasing added sugars intakes. Total energy intake (kJ) increased with increasing added sugars intake by 2707 kJ comparing group 1 (0 to <5% kJ from added sugars) and group 6 (≥25% kJ from added sugars). For adults 19+ years (Table 1), 49% were males, 67% non-Hispanic white, 12% non-Hispanic black and 14% Hispanic. Mean age was 46.9 ± 0.54 years. The percent reporting sedentary physical activity increased and the percent reporting to be current smokers increased with increased intakes of added sugars. Total energy intake (kJ) increased with increasing added sugars intake by 321 kJ comparing group 1 (0-5% kJ from added sugars) and group 6 (≥25% kJ from added sugars).
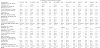
* SE= Standard Error, †Values are means.
3.2 Nutrient adequacy by usual added sugars intake levels- children
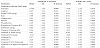
For most nutrients with an EAR (15/17) in children added sugars intake was not related (p>0.0029) to nutrient adequacy, with the exception of calcium [beta=10.48; p=0.003] and vitamin E [beta=5.72; p=0.003] (Table 2). Using a less conservative p value (p ≤0.05), the percentage with inadequate intakes was noteworthy for magnesium and vitamin D. Regression analyses using only four groups did not show any association with the nutrients studied (Table 3).
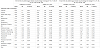
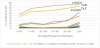
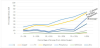
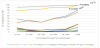
The percentage of children below EAR significantly increased for vitamin E (p=0.0029) with increasing UI of added sugars (Figure 1); across the range of added sugars intake there was an increase of about 5% of the population being below the EAR(Supplemental Table 1). For vitamin D the percentage of children below the EAR increased as UI of added sugars increased (p=0.0124). However, there were no significant associations of added sugars intake with percentage of the population below the EAR for vitamins A, C, B6, and B12, niacin, thiamin, riboflavin, and folate. The inflection point at which the greatest increase occurred was at 20 to <25% of total energy from added sugars. The percentage of children below EAR significantly increased for calcium (p= 0.0031) and magnesium (p=0.0147) with increasing UI of added sugars (Figure 2); across the range of added sugars intake there was an increase of about 10.5% of the population being below the EAR Supplemental Table 1. However, no association was seen for copper, iron, phosphorus, selenium, and zinc. Again, the inflection point at which the greatest increase occurred was at 20% to <25 % of total energy from added sugars. The percentage of children with inadequate intake, below the EAR across the range of added sugars is provided in Supplemental Table 1. The percentage of children with inadequate intakes of these nutrients was high even in the lower added sugars groups.
3.3 Nutrient adequacy by usual intake levels- adults
In adults (19+ years) for most nutrients with an EAR (16/17) added sugars intake was not related (p≥0.0029) to nutrient adequacy (Table 2). The nutrient affected was primarily vitamin D [beta=1.42; p=0.001]. Using a less conservative p value (p≤0.01), the percentage with inadequate intakes was noteworthy for vitamin E [beta=3.95; p=0.008]. Using a p value of p ≤0.05 for significance, only magnesium was significant. Regression analyses using only four groups did not show any association with the nutrients studied.
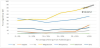
For selected vitamins (Figure 3), the percentage below EAR significantly increased only for vitamin D (p=0.0001) with increasing UI of added sugars. Across the range of added sugars intake there was an increase of about 1.4 and 3.4% of the population being below the EAR (Supplemental Table 2); but there was no significant relationships of added sugars intake with percentage of the population below the EAR for vitamins A, C, B6, B12, niacin, thiamin, riboflavin and folate. Using a less conservative p value≤0.01, the percentage below EAR significantly increased for vitamin E (p=0.0067).Using a p value of ≤0.05, the percentage of adults below the EAR for magnesium (p=0.0152) increased with increasing UI of added sugars (Figure 4).Across the range of added sugars intake there was an increase of about 9% of the population being below the EAR (Supplemental Table 2). There was no significant relationships of added sugars intake with percentage of the population below the EAR for calcium, copper, iron, phosphorus, selenium and zinc. The point at which the greatest increase percentage of the population below the EAR occurred was at 20 to < 25% of total energy from added sugars for selected minerals. The percentage of adults with inadequate intake below EAR across the range of added sugars intake is provided in Supplemental Table 2.The percentage of adults with inadequate intakes of these nutrients was high even in the lower added sugars groups.
4. Discussion
Data from this study provide a look at the relationship of added sugars to nutrient adequacy/micronutrient dilution using a recent nationally representative dataset. First, for most nutrients with an EAR (15/17 in children and 16/17 in adults) added sugars intake was not related to nutrient adequacy. Second, for those nutrients affected (primarily calcium and vitamins D and E) the percentage of the population with inadequate intakes were high even in the lower added sugars groups. For nutrients where a relationship was established, the point of inflection where lower micronutrient intakes appeared to be most apparent was between 20 %- < 25% of total energy from added sugars; regression analyses using four groups (0- <5, 5- <10, 10- <15, 15- <20% energy as added sugars) did not show significant relationships with the nutrients studied. These results suggest that poor food choices independent of, or only partially related to, added sugars intake, have a larger effect on nutrient adequacy rather than added sugars specifically.
The DGA has provided dietary recommendations since the first publication in 1980 [3]. These have always included advice for the US population to moderate or limit total sugar intake. However, the actual amount recommended was not quantified until 2002 when the IOM released the DRI report on macronutrients [4]. The IOM recommended that intake of added sugars specifically be no more than 25% of total calories consumed. This recommendation was based on ensuring sufficient intakes of essential micronutrients. The IOM panel developed tables to address the association between added sugars and specific micronutrient intakes using data from NHANES III, 1988-1994. The data showed a drop off in micronutrient intake at approximately 25% of energy coming from added sugars which is consistent with our results. It is important to note that the data were based on a selected number of micronutrients. Moreover, it has been shown [12,30] that high added sugar consumers are likely to have a different pattern of intake for a wide range of foods and as a consequence simply focusing on a reduction of added sugars alone will not necessarily improve overall quality of the diet unless other aspects of the diet are also addressed. It is established that energy intake is a major predictor of micronutrient adequacy [14].
There have been a number of review articles on intakes of added sugars and micronutrient dilution with inconsistent findings due to methodological limitations in defining added sugars, methods of analytical approaches, and degree of interpretation of results based on confounding variables [12-14]. The variation in the added sugars content of foods and beverages across nutrient databases is considerable [11]. The United States Department of Agriculture/ Agriculture Research Service (USDA/ARS) Nutrient Data Laboratory removed the added sugar content of selected foods from their database because of the constant changes in formulations for commercial and multi-ingredient foods [31]. Fortunately the USDA, as part of MyPyramid Equivalents Databases and the subsequent Food Patterns Equivalent Databases, has provided added sugars values for foods in NHANES for each new data release.
The finding that most nutrients were not significantly related to added sugars intake may be due to the fact that many of the nutrients examined are added to foods either via enrichment or voluntary/ mandatory fortification. Most grain products with or without added sugars are enriched with thiamin, riboflavin, niacin, and iron. All non-whole grain products are mandated by US Food and Drug Administration to be fortified with folic acid. Most ready-to-eat cereals and many nutrition bars, including those with both higher and lower amounts of added sugars, are fortified with 10 or more nutrients from 10-100% of the Daily Value. Thus, consumers of these fortified products, while getting more added sugars in the diet, were also getting more micronutrients which may have thus attenuated any relationship of nutrient adequacy with added sugars. One study showed that the positive effect of fortification on nutrient densities was greater than the negative effect of added sugars [32]. Thus fortified foods with added sugars could counteract nutrient dilution [32]. Also of importance is that without fortification or enrichment, despite added sugar content, many Americans would not achieve the recommended micronutrient intakes [33].It is also important to note that there are few foods that provide high levels of nutrients most affected in our study, namely calcium (e.g. milk, cheese, and yogurt), and especially vitamins D (e.g. fortified foods, fatty fish, and beef liver) and E (e.g. almonds, vegetable oils, and leafy green vegetables) and as such without the presence of meaningful amounts of these foods in the diet, adequate levels of intake from food may always be low for these nutrients.
Recently there has been a drop in added sugars intake primarily from a drop in consumption of sweetened beverages [34]. As this is a recent finding more research is needed to continue to assess scientifically at what level of intake of added sugars is significantly associated with micronutrient intake across multiple age groups.
5. Limitations
This study had a number of limitations. NHANES is a crosssectional study, thus cause and effect relationships cannot be determined. Another limitation is the use of dietary recalls to assess intake in NHANES. Participants relied on memory to self-report dietary intakes; therefore, data were subject to non-sampling errors, including under or over-reporting of energy and foods, and possibly particularly those foods with added sugars. Parents reported or assisted their children 2-11 years with the 24-hour recalls; parents often report accurately what children eat in the home [35] but may not know what their children consume outside the home [36], which could also result in reporting errors [37]. The results could reflect the influence of other foods consumed/not consumed throughout the day among the added sugars groups [12,30]. When interpreting the results one needs to consider the methodological limitations in defining added sugars, methods of analytical approaches (estimating added sugars usual intakes and classification of subjects into groups based on UI of added sugars intake), and the variation in the added sugars content of foods and beverages across nutrient data bases [11-14,31].
Various methods have been proposed either to estimate the distribution of UI or to predict individual-level UI for use in regression analyses. The simplest analytical approach such as using one-day of dietary intake, uses the within-person mean and usually leads to biased (usually larger) estimates of the prevalence of either excess or inadequate intake. The UI method takes into account reported days with zero consumption or for positively skewed consumptionday amounts; distinguishes between –person and within –person variation; allows for the correlation between the consumption –day amount and the probability of consumption; and, relates covariate information to UI [28,38]. The UI method is an improvement over previous methods because the more simplistic methods do not take into account the challenges addressed above. The authors also conducted the analyses in this study using one-day dietary intake data and there were a few shifts in the results, mainly attenuated p values. This may be because the one-day data included the extremes at both ends of intake which likely affected relationships. The UI approach adjusts for the extremes so hopefully provides a more meaningful relationship. Future work might consider co-modeling added sugar’s intake with energy intake and nutrient intakes using more sophisticated models becoming available.
Competing Interests
VLF as Vice President of Nutrition Impact, LLC performs data analyses of large government databases like NHANES for numerous members of the food, beverage, and dietary supplement industry. T.A.N has received numerous grants from the food and beverage industry and federal agencies throughout her career. CO’N has received a number of federal grants throughout her career, including those from the Economic Research Service and National Institutes of Health.
Author Contributions
T.A.N, C.O’N. and V.L.F contributed to the concept development and the overall research plan; V.L.F. contributed to the methodological and statistical aspects of the work; T.A.N. wrote the initial draft; C.O’N. and V.L.F. critically reviewed and edited the manuscript and data. All authors read and approved the final manuscript.
Acknowledgments
This work is a publication of the USDA/ARS Children’s Nutrition Research Center, Department of Pediatrics, Baylor College of Medicine, Houston, Texas. The contents of this publication do not necessarily reflect the views or policies of the USDA, nor does mention of trade names, commercial products, or organizations imply endorsement from the U.S. government.