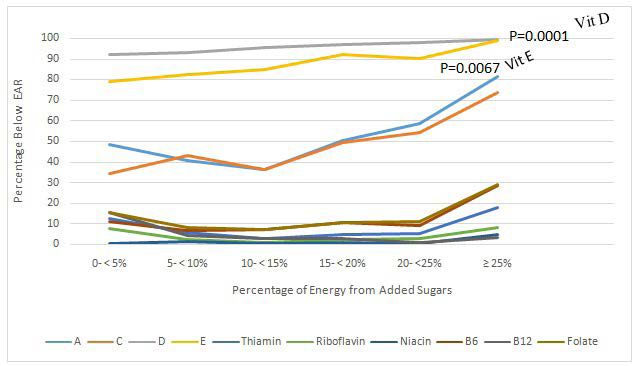
Figure 3: Percentage of adults 19+ years (n= 6,111) below the Estimated Average Requirement (EAR) with increasing added sugars intake. P is p value for trend across percentage of energy from added sugars, Trend in vitamin D intake across percentage of energy from added sugars did meet the Bonferroni correction p value ≤0.0029. Trend in Vitamin E intake across percentage of energy from added sugars did not meet the Bonferroni correction p value ≤0.0029; but was significant at a p value≤0.01.