


1. Introduction
Numerous studies have demonstrated that people who eat more fruits and vegetables (F/V) are better protected against cardiovascular disease [1], cancer [2], age-related degenerative disease [3], obesity [4], and other diseases [5,6]. Studies using a quantitative food frequency questionnaire have demonstrated lower F/V intake in low-income African American population in inner-city Baltimore [7]. Working with African American men in Nashville, Tennessee, Griffith et al. [8] reported that only 17% of the participants met the healthy eating recommendation of five fruits and vegetables per day, compared to 24.5% of general adult US population [9]. Carotenoids are important bioactive substances found mostly in F/V [10], not synthesized in the body, and are independently and inversely associated with chronic disease mortality [11-13]. Blood concentrations of carotenoids are correlated with skin carotenoids and non-invasive assessment of skin carotenoids may be used as a biomarker of fruit and vegetable intake [14-16]. Considering the challenges and shortcomings of dietary assessment methods such as dietary recalls, skin carotenoid status can be used to approximate blood carotenoid concentrations and selfreported F/V intake in dietary studies and surveillance.
Skin carotenoid status measured by pressure-mediated reflection spectroscopy (RS) is emerging as a valid and reliable biomarker of both blood carotenoid concentrations and F/V intake [17]. The technology and validation studies for RS have been well-characterized in the literature [17-19], however, to date, only one small study has included minority groups such as African Americans [20]. The reflection-based method measures the reflection spectra emitted by carotenoids in the skin, however, how skin pigments such as melanin affect the reflection spectra has not been clearly demonstrated. Although the technology has existed for a decade, it is only recently that a portable device has been designed and marketed to measure skin carotenoid status, and little is known of its performance, particularly in minority populations. The purpose of this study was to examine the relationship between plasma carotenoids and skin carotenoids measured by pressure-mediated reflection spectroscopy measured by Veggie Meter (Longevity Link Corp., Salt Lake City, UT) in African American/Black college students with varying skin tones and to examine the relationship between these two biomarkers to dietary estimates of carotenoids and F/V intake.
The study’s hypotheses included the following: 1) There is a significant correlation between plasma total carotenoid concentration and Veggie Meter score; 2) The correlation between plasma total carotenoid concentration and Veggie Meter score is independent of skin tone; and 3) There is a significant correlation between Veggie Meter score, dietary carotenoids, and fruit and vegetable intake.
2. Materials and Methods
2.1 Participants and recruitment
The Morgan State University Institutional Review Board approved the study protocol and all participants provided written informed consent. Students were recruited by announcements posted at Morgan State University websites, bulletin boards, and face-to-face classes from January to May 2019. Of the 116 students who expressed interest in participating in the study over four months, 11 were deemed ineligible because they did not meet one or more inclusion criteria, two did not want their blood drawn, and three had scheduling conflict. One hundred students signed the consent form and completed the study. Inclusion criteria included age 18 - 30 years, apparently healthy, non-smoker, and self-identified as African American/Black. Interested individuals were emailed a colorful list of high-carotenoid foods to avoid 24-hours before their admission interview and blood draw. Groups of participants were given appointments to come in for their admission interview which lasted from 60 to 90 minutes depending on the number in the group. In addition to the principal investigator (PI) and the phlebotomist, at least two well-trained Nutritional Science/Dietetics senior students (Research Assistants) were always available to help and guide participants with their self-administered questionnaires asking them about their demographics and lifestyle habits. The PI and the Research Assistants measured participants’ anthropometrics, skin tone, and RS scores. Phlebotomist completed blood draw and each participant received a gift card at the completion of the admission interview.
Estimated required sample size (number of participants) needed for detection of a correlation of 0.3 was n = 85 with the assumptions of p (proportion in the population) = 0.5, α = 0.05 (two-sided), and power = 0.80.
2.2 Dietary and demographic information
Participants were instructed to avoid any high-carotenoid foods 24 hours prior to their appointment for admission interview and non-fasting blood draw to prevent any sharp increases in their blood concentration of carotenoids. At the beginning of the Admission Interview, each participant was shown the colorful list of high-carotenoid foods which was e-mailed to them earlier and asked if they had any of those foods or beverages over the last 24 hours. In case the participant reported high-carotenoid food intake over the last 24 hours, he/she was given another appointment and was asked to come back later. On the day of admission interview and blood draw, after signing an informed consent form, a modified version of Health and Nutrition Questionnaire [21] was self-administered to collect demographic information such as age, sex, ethnicity, college class year, and other pertinent information related to the study including medical/family history of disease or conditions, medications, vitamin/ mineral supplements including beta-carotene, herbal supplements, smoking, and hours spent in the sun per week. They were also asked about what they usually eat, fluid (water, juice, soda, etc.) intake per day, and if they were vegetarian (vegan, lacto-ovo vegetarian, lacto- or ovo-vegetarian, and other).
Participants were then provided with a 44-item Carotenoid Screener to estimate their carotenoid intake (Appendix 1). The Carotenoid Screener asks the participant to report the number of servings of 44 food and beverage items containing carotenoids over the last seven days, very similar to a food frequency questionnaire (FFQ). The Carotenoid Screener/FFQ was developed at USDA-ARS Grand Forks Human Nutrition Research Center, Grand Forks, ND and was originally web-based. However, in this study, a paper and pencil version of the FFQ was used and the completed FFQs were sent back to USDA-ARS Grand Forks Human Nutrition Research Center to be analyzed on its corresponding data base for the number of servings of F/V and carotenoids (ß-carotene, α-carotene, ß-cryptoxanthin, lycopene, and lutein+zeaxanthin) per day. During the administration of the questionnaire, participants were instructed to go over every food/beverage item in the FFQ and record the amounts consumed based on the serving sizes shown on the FFQ. After completion by the participant, either the PI or a research assistant reviewed the FFQ with the participant and made sure they have recorded every item consumed and the amounts are correct to the best of their knowledge.
2.3 Skin carotenoids and anthropometrics
During the Admission Interview, each participant's height and weight was measured using a SECA 763 digital stadiometer/ scale (SECA, North America, Chino, California) and their body composition was also recorded using another scale (Tanita SC-240 IM Ironman, Tanita Corporation), while wearing light clothing and no shoes and socks. Height and weight were used to calculate body mass index (BMI) (i.e., weight in kilograms/height in meters2). Skin tone was matched visually and read using a skin swatch from Pantone [22] on a scale of 01 - 15, 01 being the lightest and 15 the darkest. During the four months of study period, one operator was able to do 90% of skin tone matching on participants. In rare occasions, when he was not available, he would train another operator to do skin tone matching. Skin tone at the index fingertip was recorded for all (N=100) participants, whereas inside the lower arm skin tone was recorded for 62 participants. After about a month into the study, it was decided that another body site like inside lower arm needs to be read/measured for confirmation of the index fingertip skin tone. Skin carotenoid scores were measured using the Veggie Meter [16] (Longevity Link Corp., Salt Lake City, UT) which is a portable pressure-mediated reflection spectroscopy device. Following manufacturer’s instructions, each participant placed his/her index fingertip inside the cradle of the scanner and held it for 10 seconds. The scanner emitted a light and displayed a Carotenoid Score on a scale from zero to 800. Before the measurement, the Veggie Meter operator checked the index finger to make sure it is perfectly clean and free of any contamination. The participant was asked to wash his/her hand with soap and water in case the index finger was not clean or had stains on it. Each person was scanned three times on the same finger and average of three scans was displayed.
2.4 Blood carotenoids
On 99 non-fasting participants, a 7-ml blood sample was collected from an arm vein into a glass vacutainer tube with ethylenediaminetetraacetic acid (EDTA) as the anticoagulant and centrifuged to separate plasma. Two aliquots of approximately 200 μL were collected in polypropylene centrifuge tubes, placed on dry ice protected from light, and then frozen at -80⁰C. Upon completion of sample collection, the samples were packaged on dry ice and shipped overnight to the USDA-ARS Grand Forks Human Nutrition Research Center, Grand Forks, ND for carotenoid analysis. Plasma samples were analyzed for α-carotene, ß-carotene, ß-cryptoxanthin, lycopene, lutein, and zeaxanthin according to the method of Bukowski et al. [23] Briefly, samples were thawed in the dark on ice, then homogenized by vortex mixing. A 10 μL aliquot of human plasma was combined with 990 μL methanol containing tocopherol acetate (internal standard, 50 nM) and vortexed. Protein was removed by centrifugation and the supernatant was analyzed by high-performance liquid chromatography-electrospray tandem mass spectrometry (HPLC-ESI- MS/MS) using a Shimadzu 8050 LCMS system (Shimadzu USA, Columbia, MD, USA). Analytes were separated on a 150 mm x 2.0 mm, 2 μm C30 column with a 10 mm C30 guard column (YMC America, Allentown, PA, USA). Calibration solutions were prepared fresh daily, and samples were prepared in duplicate batches of 20. To ensure quality control (QC), duplicate measurements with a coefficient of variation (CV) exceeding 10% were re-run. Each batch was accompanied by QC samples consisting of National Institute of Standards and Technology, Standard Reference Material, Fat-Soluble Vitamins in Frozen Human Serum (NIST SRM 968 F) Level 1 and Level 2 at the start and end of each run (NIST, Gaithersburg, MD, USA). Intraday variation for QC samples was below 10% CV for both levels, experimental duplicates with a CV>10% were re-run. Inter-day variation across all sample sets for the QC samples were below 10% except for α-carotene (Level 1, 13.7%), lutein (Level 2, 10.7%), and zeaxanthin (Level 1, 22.5%). The measured value for lycopene was greater than the stated value for NIST SRM 968 F, owing to the improved recovery of lycopene from plasma in the “dilute-and-shoot” method where a 10μL aliquot of plasma was diluted into 990 μL of methanol containing an internal standard. Protein was removed by centrifugation and samples were analyzed by HPLC-ESI-MS/MS [23].
2.5 Statistical analysis
Descriptive statistics mean ± standard deviation (mean ± SD) or number of samples and percentage, n (%), was used to present participant characteristics. Independent sample t-tests were used to examine the significance of difference between means. Mean RS scores, plasma carotenoid concentrations, dietary carotenoids, and number of F/V servings/day were compared with respect to sex (male or female). Linear regression models were used to examine the correlation between RS scores measured by Veggie Meter with total plasma carotenoid concentrations, dietary carotenoids, and F/V intake. Multiple linear regression analysis was conducted to assess the relationship of skin tone at the fingertip and inner arm, BMI, and percent body fat on the correlation between RS scores and total plasma carotenoid levels. All analyses were conducted using SPSS version 26.0 [24] and a p value of <0.05 was considered significant. As adopted from Mukaka for studies related to medical research [25], the interpretation of the correlation coefficients was considered weak (0.00-0.49), moderate (0.50-0.69) or strong (0.70+) based upon interpretations used by Jahns et al. [26].
3. Results
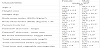
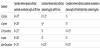
Of the 100 participants who started the study, one participant was not able to complete the blood draw. Demographics and other characteristics of participants are presented in Table 1. There were no differences in age (p= 0.907), or BMI (p= 0.386), and the individuals with BMI >30 (p= 0.084) across men and women. There were no differences in mean Pantone skin tone measured on finger (p= 0.168) or inner arm (p= 0.406) across men and women. There were no differences in mean RS scores (p= 0.116), total plasma carotenoids (p= 0.177), total carotenoid intake (p= 0.075), or fruit and vegetable intake (p= 0.160) in men as compared to women. Other characteristics of the participants are presented in Table 2.
3.1 The correlation between skin carotenoid scoresand plasma carotenoid concentrations
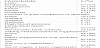
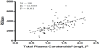
Skin carotenoid scores indicated by RS Scores measured by Veggie Meter were moderately correlated with total plasma carotenoid concentrations (see Figure 1, R= 0.595, p<0.01). Using the Bonferroni outlier test and Cook’s distance for data point’s influence, one participant with very high carotenoid status was considered a positive outlier and removed from the correlation. The results revealed that skin tone was not a significant covariate either at the fingertip (Beta= 0.124, p= 0.123), or at the inner arm (Beta= 0.177, p= 0.063) for the relationship between plasma carotenoid concentrations and skin carotenoid score in this population. Similarly, multiple linear regression analysis to assess the relationship of BMI and percent body fat (%fat) on the correlation between RS and total plasma carotenoids in this population shows that neither BMI (Beta=0.013, p= 0.904) nor %fat (Beta= -0.128, p= 0.243) were a significant covariate for the relationship. Individual plasma carotenoid concentrations (β-carotene, α-carotene, β-cryptoxanthine, lycopene, and lutein+zeaxanthine) each correlated significantly with RS scores (Table 3).
3.2 Skin carotenoid scores compared with diet
Skin carotenoid scores indicated by RS Scores measured by Veggie Meter were correlated with total carotenoid intake measured by FFQ (R= 0.249, p<0.05) and total fruit and vegetable intake per day (R= 0.327, p<0.01). The results indicated that skin tone was not a covariate on the correlation between RS scoares and total carotenoid intake at the fingertip (Beta= 0.099, p= 0.319) or at the inner arm (Beta= 0.234, p= 0.082).
Multiple linear regression analysis was performed to assess the relationship of BMI and percent body fat (%fat) on the correlation between RS and total carotenoid intake, and RS and total fruit and vegetable intake per day (F/V/day) in this population. On RS and total carotenoids, BMI was not a covariate (Beta= -0.077, p= 0.445), and the same with RS and F/V/day (Beta= -0.106, p= 0.286). However, %fat was a covariate in both cases: RS and total carotenoids (Beta= -0.197, p<0.05), and RS and F/V/day (Beta= -0.204, p<0.05).
3.3 Plasma carotenoid levels compared with diet
Total plasma carotenoid levels did not correlate with total carotenoid intake (R= 0.032, p= 0.756). The correlation between total plasma carotenoid levels and total F/V/day was weak, but significant (R= 0.206, p<0.05). Only two individual carotenoids (β-cryptoxanthine and lutein+zeaxantne) in plasma correlated significantly with individual dietary carotenoid intake (Table 3).
4. Discussion
The present study, for the first time, has demonstrated the correlation between skin carotenoid status indicated by RS score measured by Veggie Meter with plasma carotenoids and F/V intake in a large group of healthy African American/Black adults. This important result is novel as almost all previous studies have been conducted in other groups. Only one small study has targeted a diverse sample including African Americans and reported no association between self-reported total F/V and RS-assessed skin carotenoids [20].
Skin carotenoid status has been extensively validated against blood carotenoid concentrations using resonance Raman spectroscopy (RRS) among adults [27,28] and children [29,30], however fewer validation work has been done using RS. The technology, the Veggie Meter, is being used increasingly in the US and internationally to measure skin carotenoid status, and therefore validation studies are needed.
Several factors may affect skin carotenoid levels and RS scores [14,31], and up to now, it has been unknown if melanin in skin is one such potential confounder in the measurement of skin carotenoid concentrations for the purpose of assessing F/V intake. Use of color swatches to identify skin tone (Pantone Skintone Guide) was a crude measure of skin tone used in this study. Other methods of identifying skin tone with more accuracy such as skin biopsies to assess melanin concentration in skin, or a spectrometer which can measure skin tone were not available to this investigation. Future research is needed to explore the relationship between melanin and skin tone and support the appropriate interpretation of skin carotenoid scores as a biomarker of F/V intake in different populations. A limitation of the study was the relatively narrow range of skin tones. It is important to recognize that skin tone is not ruled out as a covariate for studies of populations with a diverse population and greater range of skin tone. Assessing intra-and inter-participant agreement between skin tone readers by Pantone may be considered another limitation of the study, even though 90% of the Pantone reading was done by the same individual in this study for a period of four months. Other limitation was that after about a month into the study, it was decided that another body site needs to be read/measured such as inside lower arm for confirmation of the index fingertip skin tone. Because use of color swatches may be somewhat subjective measure of skin tone, it is recommended to use at least two body sites to read skin tone. Pantone readings on the fingertip and inside of the lower arm correlated significantly in current study (R= 0.639, P<0.01, N= 62).
The correlation between RS scores and plasma carotenoids was moderate but very similar to the few other studies comparing the two. Jahns et al. found a cross-sectional correlation of r= 0.70 in a sample of white women using a prototype RS device [26]. Jilcott- Pitts et al. [20], conducted a validation study in a diverse sample of corner store patrons using the Veggie Meter. In their study, RS scores of 309 African American corner store customers in Eastern North Carolina were lower than the present results (239 ± 86 compared to 320 ± 118); and the correlation with blood carotenoid concentration in a small subset of individuals was lower (r= 0.54), although moderate [20]. They found a significant correlation between RS scores indicating skin carotenoids and F/V intake using an FFQ tool to assess F/V intake. Reasons for the differences reported may include differences in assessing dietary intake, as the FFQs used were different. Another factor was BMI, which was higher in this study, as adipose tissue may act as a metabolic sink for fat-soluble compounds, including carotenoids, thus sequestering carotenoids away from plasma circulation as reviewed by Bonet and colleagues [32], and may confound the relationship between RS scores and dietary intake measures. Current study shows percent body fat as a covariate in the relationship between RS score and total carotenoid intake and fruit and vegetable intake.
Skin carotenoid status measured by RS was correlated with both FFQ-assessed F/V intake and carotenoid intake. This contrasts with several studies using RRS which found no relationship of skin carotenoid status and self-reported F/V intake, although the literature is mixed and dependent upon the method used for reporting dietary intake data [26,27]. FFQ-assessed total carotenoid intake in this study is in good agreement with total carotenoid intake reported in What We Eat in America, NHANES 2016-2017 for comparable groups [33]. Although the correlations of F/V intake with plasma carotenoid concentrations was weak, it is similar to those found in validations of other FFQs [34].
5. Conclusions
Skin carotenoid status measured by RS score measured by Veggie Meter can be used to approximate blood carotenoid concentrations and self-reported F/V intake in African American/ Black US college students. Future research is needed to validate this non-invasive and portable technology in diverse populations and use it under different settings including intervention studies to increase F/V intake and public health studies to determine F/V intake by individuals and populations.
Competing Interests
The authors declare that they have no competing interests.
Author Contributions
The authors responsibilities were as follows – BF and LK: designed the research and wrote the first draft of the manuscript; BF, LK, JLG, CMB, and SS: conducted the research; MRB: did the laboratory analysis; TTJ and BF: did the statistical analysis; and all authors: read and approved the final manuscript.