


1. Introduction
Colostrum bovinum is and early milk of cows which differs in its composition in comparison to the mature milk. It possesses all of the substances needed for a proper development of a newborn. It is rich in protein, fat, as well as oligosaccharides and micronutrients. It contains lactoferrin, lysozyme and immunoglobulins that have immunostimulatory function [1,2]. Colostrum has anticancer properties and can be used in a treatment of autoimmune disorders [3] . Due to growth factors colostrum stimulates the muscle development and decreases recovery time [4] . For the above mentioned reasons, colostrum fortification brings new possibilities to create functional food products.
The aim of this article was to investigate how colostrum addition would influence microbial acidification of milk in the production of yoghurt. It was suspected that antimicrobial properties of colostrum bovinum may inhibit acidification process, which in turn may translate into longer clot formation (decreasing rigidity of created protein network) [5] . This, together with increased protein and lipid content would affect properties of manufactured products (especially particles’ size distribution and water holding capacity) which are important factors in terms of sensory acceptance.
2. Materials and Methods
2.1 Materials
Commercial milk Łaciate 2% UHT, yoghurt cultureYO-MIX 496 or 495 LYO Danisco 100 DCU, lyophilized colostrum Genactiv Colostrigen 31.07.2019, spray dried defatted colostrum Colostrum Max Immuno First Aid batch number 007218, 03.2020. Both of the colostrum preparations wereprepared from milk obtained within 24 hours from calving.
2.2 Yoghurt production
Milk was heated to 43°C, inoculated with yoghurt culture (10 DCU/100 l) and poured into sterile glass bottles intended for separate technological variants. Respectively:
0 – control – yoghurt without colostrum,
A –0.5% colostrum addition to inoculated milk before incubation,
B –1% colostrum addition to inoculated milk before incubation,
C –0.5% colostrum addition to inoculated milk after incubation,
D –1% colostrum addition to inoculated milk after incubation.
After division of milk into glass bottles, colostrum was added into variant A and B and all bottles were set aside for incubation. Incubation was performed at 43°C and lasted until pH ≈ 4.65 in the control.
Incubation was followed by cooling in ice water to a temperature approximately 20°C. Next, appropriate amount of colostrum was added to variants C and D. All variants were mixed and stored at 4°C until further analysis.
2.3 Microbiological analysis
2.3.1 Total plate count
Total plate count was analysed according to ISO 4833-1: 2013-12 [6] with a plate method, deep inoculation, MPCA medium, incubation 30°C/ 72h under aerobic conditions.
2.3.2 Enumeration of characteristic microorganisms
Characteristic microorganisms count was examined as stated in ISO 7889:2007/AP1:2007 IDF 117: 2003 [7] :
- Str. thermophilus - M17 medium, incubation 37°C/ 48 h, aerobic conditions,
- Lbc. bulgaricus - MRS medium pH 5.4; incubation 37°C/ 72h, anaerobic conditions.
2.3.3 Enumeration of mesophilic lactic acid bacteria
Enumeration of mesophilic lactic acid bacteria was done due to ISO 889: 2007/AP1: 2007 IDF 117: 2003 [8] . Analysis was performed using a plate method, deep inoculation, MRS medium pH 5.7. The samples were incubated at 30°C for 72h under oxygen conditions.
2.3.4 Enumeration of Lactobacillus
Bacteria Lactobacillus were counted using a plate method with deep inoculation on Rogosa medium. The samples were incubated at 35°C for 72h under anaerobic conditions.
2.3.5 Enumeration of colony forming units of yeast and/or moulds
Enumeration of yeast and/or moulds was done in accordance to ISO 6611:2007 [9] using a plate method with deep inoculation on YGC medium. The samples were incubated at 25°C/ 5 days under aerobic conditions.
2.4 Physicochemical analysis
2.4.1 Dry mass
Dry mass was examined in agreement with international standard ISO 6731:2010 [10] by drying the sample at 102°C±2°C.
2.4.2 Protein content
Protein content was measured according to ISO 9868-1:2014 [11] . Yoghurt was weighted into a Kjeldahl flask together with a catalyst and concentrated hydrogen sulphate (VI) 96%. Then the sample was mineralized. Mineralized flasks were distilled with use of KjeltecTM 8400 Analyser Unit. An excess of 1M sodium hydroxide was added to the sample. Distillation was carried out using water vapor to an excess of 1% boric acid. The distillate was titrated with the nominated 0.1 M hydrochloric acid solution. The nitrogen content was calculated from the amount of ammonia produced. Protein content was calculated based on nitrogen content.
2.4.3 Fatcontent
Fat content was extracted and measured according to the norm ISO 1211:2010 [12] .
2.4.4 Profile of fattyacids
Fatty acids profile was analyzed according to international standard ISO 15885 IDF 184 [13] with use of gas chromatography (GC), Agilent GC 7890A with FID (flame ionization detector).
2.4.5 Rheological measurements
Rheological measurements were performed with use Kinexus pro+ (Malvern Panalytical) equipped with 40 mm parallel plates.
2.4.5.1 Rotational rheological measurements
First, rotational measurements were performed with use of smooth parallel plates. It was observed that rheometer had problems with data collection - local decrease in sample response, indicating slip wall effect. Due to the above, for further analysis sand blasted parallel plates were used.
Rotational rheological analysis was done at 10°C, with 0.5 mm measuring gap within 0.03 - 300 1/s shear rate.
Yield stress was measured between at the same temperature, exploiting the same measuring gap, within range: 0.5 - 5.0 Pa. Value of yield stress was appointed as the highest point on the shear stress curve. Yield stress equals force that has to be applied to the material in order to make it flow.
2.4.5.2 Oscilatoryrheologicalmeasurements
First, amplitude (A) shift experiment was performed in order to establish linear viscoelastic region. Then, frequency (F) shift experiment was performed. Parameters used for analysis were: F =10- 0,01 Hz, A = 1%. Results allowed to establish viscoelastic properties of the analyzed sample within different time scale (low frequency = long time (slow deformation), high frequency = short time (quick deformation).
2.4.6 Water biding capacity analysis
Water biding capacity was examined due to Crispín-Isidro i in. (2015) method [14] . 10 g of yoghurt was weighted into a centrifugation vessel. Then the sample was centrifuged at 4°C under 2800 g for 10 min. Supernatant was decanted and weighted. Water biding capacity was calculated as:
where
WBC – water biding capacity, %,
ma – mass of the analyzed sample, g,
ms – mass of the supernatant, g.
2.4.7 Particles size distribution measurement
Particles size distribution was measured with use of light scattering method. Analysis was performed exploiting Mastersizer 3000 (Malvern Panalytical) equipped with a camera Hydrosight. Distilled degassed water was used as a dispersant. Prior to the analysis, the sample was gently mixed with the dispersant in a ratio of 1:15 vol. Method parameters were: sample RI = 1.75, dispersant RI = 1.33, obscuration: 14-15%, moderate stirring [15] .
What is more, microscope preparations were done in order to observe fat globules within the sample. Fat globules were dyed with sudan. To obtain clear vision it was necessary to dilute the sample with distilled water (1:10, v:v). For staining, 0.5 ml of the prepared dilution was taken and, with stirring, 4.5 ml sudan solution (sudan: glycerine = 1: 1, v:v) was slowly added. The preparations were analyzed under the Olympus BX41 optical microscope.
2.5 Statistical analysis
Statistical analysis was performed using Excel (Microsoft Office 365 Pro Plus) and Statistica 13. The level of significance was assumed to be α = 0.05, unless stated otherwise.
The results were assessed within groups according to: colostrum preparation (Colostrigen/Colostrum Max), technological variant (0/A/B/C/D) and time of analysis (after production/after storage). Obtained data were presented using descriptive analysis. Next, the assumptions about the normality of distribution (Shapiro Wilk Test) and equality of variances (Levene Test) were checked within investigated groups. If the assumptions were met, the analysis of variance was carried out with parametric tests. Otherwise, nonparametric tests were used.
2.5.1 Comparison of samples at the same time level
Fulfilled requirements of normal distribution and equality of variance
First, one way ANOVA was performed to check if compared variants are different. Then, multiple comparison tests were carried out with RIR Tuckey test.
Violated requirements of normal distribution and/or equality of variance
Variants where analyzed with use of Kruskal-Wallis multiple rank test.
2.5.2 Comparison of samples after production vs after storage
If requirement of normal distribution was met, results were analyzed with use of T test for dependent samples. Otherwise, results were tested with Wilcoxon signed rank test.
3. Results and Discussion
3.1 Comparison of colostrum preparations
3.1.1 Microbial analysis of colostrum preparations
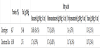
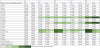
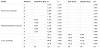
Results of microbiological analysis of Colostrigen and Colostrum Max are presented in Table 1. Both of the colostrum preparations were of high microbial quality, although Colostrigen had slightly higher total plate count and lower number of Lactobacillus.

3.1.2 Physicochemical analysis of colostrum preparation
Colostrigen had higher fat, and lower protein content than Colostrum Max (Table 2), which was a consequence of their preparation (Colostrum Max was defatted before dehydration). When considering fatty acids, it seems that Colostrum Max had a higher share of: myristic acid (C14:0), pentadecanoic acid (C15:0), palmitic acid (C16:0), margarine acid (C17:0), heptadecanoic acid (C17:1), stearic acid (C18:0), oleic acid (cis) (C18:1Δc), linoleic acid (C18:2) and conjugated linoleic acid (C18:2 CLA) (Table 3). In turn, Colostrum Max had higher share of unsaturated fatty acids (Table 2). However, since the fat content of Colostrum Max was very low, their contribution to yoghurt composition was likely to be insignificant.
3.2 Comparison of yoghurts fortified with colostrum
3.2.1 Kinetics of microbial acidification of milk
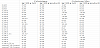
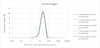
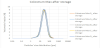
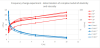
Analysing the course of acidification curves (Figure 1) of control samples (without the addition of colostrum) with samples A (0.5% colostrum addition before incubation) and B (1% colostrum addition before incubation), it can be concluded that the addition of colostrum not only did not inhibit the growth of yogurt bacteria, but accelerated acidification kinetics of milk-inoculated with yoghurt culture. In both experiments, the addition of 1% colostrum had a more pronounced effect on the rate of acidification compared to the addition of milk fortified with 0.5% colostrum.
It can be observed that around pH 6.00 there was suppression of acidification process, which was most likely the effect of insufficient amino acids for further development of the strain. Similar results were obtained by Letort et al. (2002) who investigated diauxic growth of Streptococcus thermophilus in milk [16] . The author hypothesised that the growth rate limitation was dependant from utilization of casein micelles. The rate of transport of proteolysis products was too slow to ensure subsequent growth of the strain. In the experiment with production of yoghurts enriched with colostrum, suppression phase was lifted upon addition of Colostrum Max (both 0.5% and 1%), which was rich in easily accessible (denaturated) proteins.
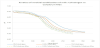
3.2.2 Microbial analysis of yoghurts
The results of microbial analysis of yoghurts fortified with colostrum are put in Table 4. The number of yoghurt bacteria Lactobacillus delbrueckii subsp. bulgaricus and Streptococcus thermophilus (CFU/ ml) after incubation were on a similar level in comparison to the control sample for both experiments (fortification with Colostrigen as well as Colostrum Max). However, in the case of the Colostrigen experiment, the number of Lactobacillus delbrueckii subsp. bulgaricus was at a much lower level in A, B, C and D variants than in analogous tests with Colostrum Max. This may be due to another yogurt culture used in both experiments. In samples of yogurt with Colostrigen and Colostrum Max stored under refrigeration for 28 days, the number of Lactobacillus delbrueckii subsp. bulgaricus decreased slightly, while the number of Streptococcus thermophilus was at a similar level. After this storage period in the yogurt tests with Colostrum Max, a greater decrease in pH was noted.
3.2.3 Physicochemical analysis of yoghurts
The addition of colostrum preparation in both cases increased the protein content. As far as Colostrigen is concerned, fat content was increased as well. Similar results were obtained by Das et al. (2012) conducting experiments on the Indian Dahi [17] .
Yoghurts enriched in Colostrigen had higher content of myristic acid (C14:00), palmitic acid (C16:00), stearic (C18:00) and oleic acid (C18:1 Δc), the content of all of those acids was higher when colostrum was added after incubation (Table 6). Technological variants of yoghurts enriched with Colostrum Max did not differ in fatty acids content. Thus, fatty acids profile after 4 weeks of storage was examined only in yoghurts fortifies with Colostrigen.


Analysis of fatty acid composition after 4 weeks of storage revealed that there is a slight decrease in stearic (C18:00) and oleic acid (C18:1 Δc) in all of the examined yoghurts (Table 7).
3.3 Microscopic preparations
The yoghourts with Colostrigen were subjected to staining with sudan to examine fat globules. All microscopic preparations could be characterized by two repeating fields of vision: 1 - extensive aggregates of small fat globules; 2 - regular chains of different sized fat globules. In general it was observed that yoghurts enriched in colostrum had smaller aggregates of fat globules than a control sample. The grater was the colostrum addition; the better stabilization of fat globules was obtained. Moreover, addition of colostrum before incubation allowed to obtain smaller aggregates of fat, than the addition of the Colostrigen preparation after incubation.
It is probable, that structure of yoghurts began to develop at the level of milk homogenization. The purpose of homogenization is to reduce the size of fat globules. Subsequent development of the interface causes the native membrane material to be insufficient to cover the newly formed droplets of the dispersed phase. Therefore, the milk proteins are incorporated into the membranes. It is known that there is a specific order of proteins adsorption. First to be adsorbed are casein micelles. Walstra et al. (1999) measured that casein accounts for 93% of proteins in the newly formed membrane and covers about 75% of the new droplet surface [18] . Some casein micelles are adsorbed entirely however, in most cases the membrane consists of micelle fragments or sub-micelles. Thanks to the secondary membrane, fat globules participate in the process of protein aggregation during yoghurt production. Field of view nr 2 (Figure 2) should therefore be understood as fat globules, which were incorporated into the yoghurt structure by participating in gelation. A similar phenomenon was observed by Krzemiński, Groβhable and Hinrichs (2011), who emphasize that fat globules play the role of active fillers (strengthening the curd structure) [15] .

Extensive aggregates of fine particles, namely homogenization clusters, are presented in Figure 2, field of view 1. Clusters of homogenization arise during the collision of a fat globule partially depleted from a membrane and a fat globule covered by casein micelles. Casein micelles adsorb on the surface of the second drop, merging them together (thus creating homogenization clusters). Typically, homogenization clusters are instantaneously broken by turbulent vortices. However, if the formed clusters pass through the gap of homogenizer head (because of too little protein or too slow adsorption rate) where the force density decreases, the pressure is not enough to break the clusters down. Walstra et al. (1999) specify factors promoting the formation of homogenization clusters as [18] :
- high fat content,
- low protein level,
- high homogenization pressure,
- high excess of proteins’ surface area (resulting from: low homogenization temperature, which causes slower casein micelles spreading; intensive heat treatment, which results in a small amount of serum proteins that can be adsorbed; high homogenization pressure).
Majority of created homogenization clusters can be destroyed during the second homogenization step, when low homogenization pressure is not sufficient to rapture droplets (thus there are no new homogenization clusters). In the same time, there is enough force to break existing aggregates. However, Walstraet al. (1999) outline that clusters breakup is usually followed by coalescence [18] . This may also explain why fat droplets in the vision field marked as 2 have heterogeneous size distribution and are bigger than those found in homogenization clusters.
3.4 Particles’ size distribution
The particle size distribution analysis is more reliable and more reproducible than microscopic evaluation. It carries important information about the overall structure. All of the yoghurts (both with Colostrigen and Colostrum) and a control probe were evaluated to check what was the size distribution of gel particles (straight after production, as well as after 4 weeks of storage). In case of food products, this analysis is particularly important in relation to sensory evaluation. Yoghurts whose particles are smaller than 150 μm are considered to be smooth [19,15,20].
3.4.1 Comparison of fresh yoghurts “after production”
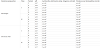
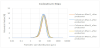
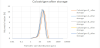
Results of particles size analysis of yoghurts after production are presented in Figure 3, Figure 4 and Table 8. All yoghurts exhibited a mono-modal course of the size distribution. The mean particle diameter measured as the Sauter mean diameter (D32) for all yogurts was less than 20μm. Yoghurts manufactured with Colostrigen exhibited consistent trend of decreasing particles size with increase of colostrum addition. In the experiment with fortification of yoghurts with Colostrigen variants B and D obtained the most favorable parameters of particles’ size distribution (variant B being better than D based on highly significant difference of Dv (90), which is a confirmation of results obtained by microscopic analysis). In case of fortification of yoghurts with Colostrum Max the dose of colostrum was of a lesser importance then the moment of its addition. The best parameters of particles’ size distribution obtained yoghurts, where colostrum was added after incubation - variants C and D (variant D being slightly better than C based on the significant difference of Dv (90)). The obtained results indicate that all tested yoghurts were within the limits set by the smoothness marker (coarse particles < 150μm).

3.4.2 Comparison of particles size distribution of yoghurts after production and after storage
3.4.2.1 Colostrigen
Results of measurements of particles’ size distribution of yoghurts fortified with Colostrigen, after 4 weeks of storage are presented in Figure 5 and Table 9. After 28 days differences between variants of yoghurts in terms of big particles (parameter Dv (90)) remained significant only between the control and the variant B (1% of colostrum addition before incubation) in favor of variant B. Moreover, variants B and D after storage were highly significantly different in terms of specific surface area, which ultimately reveals that the best technological variant of yoghurts fortified with Colostrigen, was the variant B (Table 9).

3.4.2.2 Colostrum Max
Results of measurements of particles’ size distribution of yoghurts fortified with Colostrum Maxafter storage are presented in Figure 6 and Table 10. After 28 days difference between big particles of control and analyzed samples remained significant in case of the variant C and highly significant in case of the variant D. This means that the differences between yoghurts fortified with Colostrum Max prevailed. After storage it was still the time of fortification that had a higher importance than the level of colostrum addition. However, analyzing variants A and B, as well as C and D, it was clear that the higher colostrum addition, the better were the size parameters (Table 10).

Comparing particles size distribution of yoghurts fortified with Colostrum Max after production and after storage, it was observed that the size parameters increased in case of variants 0, A and B, anddecreased in case of variants C and D, thus strengthening importance of the two latter (Table 10). It seems that in the most favorable variants of colostrum addition within both of these experiments, colostrum interacted with yoghurt, enabling them to remain small gel particles.
3.5 Rheological properties
The physical character of the curd is one of the most important features of yogurt. Velez-Ruiz, Barbosa Canowas, Peleg (1997) in the review of selected dairy products underlined that proper stiffness and absence of whey layer for years have been accepted in this product category as high quality markers [21] . For the evaluation of yoghurts, primarily textural and rheometric measurements were used.
Rheological measurements of the material can be carried out in two modes: rotational and oscillating. Oscillatory measurements are carried out in the area of linear viscoelastic region of the sample. This method gives information about the structure and organization of the material. During rotational rheological measurements, the internal structure of the material is broken. Rotational tests describe flow. These measurements are therefore complementary.
3.5.1 Rotational measurements
Rheological rotational tests were performed to determine the flow curves of yoghurts fortified with Colostrigen (Figure 7). Obtained results suggest that all yoghurts were shear thinning and that they exhibited a certain yield stress. In the shear range until 101/s addition of colostrum (except the variant A) caused increase in apparent viscosity of yoghurts. Beyond 101/s all measurement points were convergent. There are very few studies analysing the rheological properties of dairy products enriched in colostrum. Mounton and Aryana (2015) investigated the effect of adding colostrum on the properties of ice cream [22]. They showed in their experiment that there was a trend of apparent viscosity increase with increasing addition of colostrum. Similar results were obtained by Albers, Cueva and Aryana (2008) producing colostrum enriched yoghurts without fat (however, the addition of colostrum in fat-free yoghurts was much higher and ranged from 1.7% to 5.3%) [23].
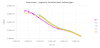
Flow curves obtained in the experiment were fitted to rheological models: Power law, Herschel - Bulkley and Cross. The best fitting was obtained in case of the Cross model (Table 11), except variant D in which it was impossible to establish coefficients for this equation.
3.5.2 Oscillatory measurements
Oscillatory measurements were carried out by placing the material between two parallel plates. The bottom plate was stationary and the upper one performed sinusoidal deviations from the equilibrium with a value which did not exceed the linear area of the viscoelastic response of the sample.
Therefore, oscillatory measurements started with amplitude shift experiment. As a result, an amplitude lying within linear viscoelastic region was found (A =1%). This value, was used in further experiments.
The behavior of all materials depends on their characteristic time constant, expressed as a dimensionless Debora constant (Equation 2).
Where,
De>>1 solids
De<<1 fluids
De~ viscoelastic materials
The manipulation of the experiment time was obtained by performing a measurement at variable frequency (high frequency = short time, low frequency = long time).
During frequency shift analysis, a storage module, which in the graph G = f (F) (Figure 8) is presented higher, determines dominant nature of the analyzed sample. Behavior of viscoelastic materials describes the storage modulus G'(elastic, characteristic for solids) and the loss modulus G "(viscous, characteristic for liquids). Elasticity modulus is a measure of a structure of a tested sample. On the other hand, the viscous modulus describes flow properties.
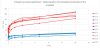
Tested yogurts at high frequencies exhibited parallel moduli curves. The elasticity modulus was located above the viscous modulus, which is characteristic for gels [24] . At low frequencies, the modulus of elasticity dropped sharply in all tested yogurts (the more, the lower the frequency). Meaning that the slow application of force caused decrease in the elastic response of the material (the experiment time exceeded the characteristic time constant of yogurt).
To simplify, the results of oscillatory measurements can be also presented in the form of complex modulus (Figure 9). They render both sticky as well as the elastic properties of the material. The formula for the complex modulus of elasticity is shown in Equation 3 and the formula for the complex viscous module Equation 4:
Where,
G* - complex module, Pa,
G’ - elasticity module, Pa,
G” - viscosity module, Pa ,
ω - angular speed, rad/s,
η* - complex viscosity, Pas.
Assuming a reference frequency of 1 Hz yoghurts were compared for their firmness [19] (Figure 10).

Firmness is an intermolecular interaction that determines the cohesion of a material. In which the elements of the body or mass of the material are held together. This parameter is related to the internal viscosity of the product (Stable Microsystems). All trials with the addition of colostrum showed lower firmness than the control sample.
Cayot et al. (2008) report that in order to classify a yoghurt as a creamy, G* should be higher than 250 Pa [19] . Therefore, the tested yogurts cannot be considered creamy (Figure 10).
3.6 Water holding capacity
The influence of the addition of colostrum on the water binding capacity of the produced yoghurts was investigated. The results are shown in Table 12. It seems that irrespectively of the colostrum type, one percent of colostrum addition improved the water holding capacity. The water holding capacity was higher in case of yoghurts fortified with Colostrigen, than in case of Colostrum Max. Since control samples also differed it might had been associated with slightly different cultures (YO – MIX 495 vs 496) used in both of these experiments. However it is also suspected that protein from Colostrigen would have better water holding capacity, because it was lyophilized (hence, its proteins remained in a native state). Similar results, showing improvement of water binding capacity by enrichment in colostrum were obtained by Das et al. (2012) (research conducted on Dahi), as well as Das and Seth (2017) (curd enriched with whey powder from colostrum, dose: 2%, 4%) [17,25].

4. Conclusions
In conclusion, conducted experiment showed that colostrum could be used to fortify yoghurts. It did not impair acidification kinetics (in fact it enhanced the process rate). It did not impair microbiological quality of the yoghurts. What is more, colostrum addition influenced the yoghurts microstructure, causing reduction of parameters of particles size distribution. In case of Colostrigen (the higher was the colostrum content, the better were parameters of particles size distribution). On the other hand, addition of Colostrum Max required colostrum dosage after incubation (which turned to be more important than the amount of incorporated preparation). What is more, yoghurts fortified with 1% of colostrum exhibited better water holding capacity. And last, but not least - all yoghurts remained stable after 4 weeks of storage.
Competing Interests
The authors declare that they have no competing interests.