


1. Introduction
A recent animal study showed that short-chain fatty acids (SCFA) produced by bacterial fermentation in the gut can directly influence L-cells to enhance the release of peptides such as glucagon-like peptide-1 (GLP-1) and peptide tyrosine tyrosine (PYY) [1].The effect of SCFA in stimulating PYY and GLP-1 secretion from L-cells has also been demonstrated in humans [2]. GLP-1and PYY are cosecreted from endocrine L-cells that are found primarily in the distal gastrointestinal tract [3,4]. GLP-1 causes reduced appetite and increases the release of insulin [5]. PYY acts to reduce appetite [6]. PYY also acts in the stomach and intestine to slow down the movement of food through the digestive tract.
Dietary fiber (DF) is indigestible carbohydrates that can be broken down by bacterial fermentation in the large intestine. Resistant starch (RS) is a type of starch that is not digested in the stomach or small intestine, reaching the large intestine intact. RS that reaches the large intestine can act as a substrate for microbial fermentation. The products of DF and RS fermentation are organic acids, mainly the SCFA acetate, propionate and butyrate, but also others such as succinate and lactate [7]. The difference in the amount and rate of SCFA production depends primarily on the type of substrate [8]. The amount and type of DF and RS consumed has dramatic effects on the composition of the intestinal microbiota and consequently on the type and amount of SCFA produced. The physiologic properties of the intestinal bacteria can be attributed to the fermentation of DF and RS.
A change in diet drives changes in the composition of gut microbiota since diet is a major determinant of the microbiota. Acute dietary fiber intake did not increase endogenous GLP-1 concentration in human subjects [9], however, dietary supplementation with fructooligosaccharide for 4 weeks increased the number of L-cells in the rat proximal colon [10]. Therefore, it is necessary to determine whether adaptations of the gut microbiota and/or endogenous gut peptide production are affected by time and/or diet.
The type of non-digestible food components consumed has a dramatic effect on the composition of the intestinal microbiota and consequently on the type and amount of SCFA produced: the major non-digestible food components that pass the upper gut are DF, oligosaccharides and RS.
In the present study, we examined the effects of DF, oligosaccharide and RS with different physicochemical properties on the amount and production rate of SCFA in the cecal contents, concentrations of GLP-1 and PYY in portal vein blood, food intake and body weight gain in rats. Furthermore, we examined whether the total bacterial community in the large intestine was significantly affected by time and/or diet.
2. Methods and Materials
2.1 Materials
Seven substrates, including cellulose (CL, JustFiber BH-200EXT, Morimura Bros., Inc., Tokyo, Japan), guar gum (GG, Taiyo Kagaku Co., Ltd., Yokkaichi, Mie, Japan), partially hydrolyzed guar gum (PHGG, SunfiberR®, Taiyo Kagaku Co., Ltd., Yokkaichi, Mie, Japan), Konjac mannan (KM, Shimizu Chemical, Coporation., Mihara, Japan), beet fiber (BF, Nippon Beet Sugar Manufacturing Co.,Ltd., Tokyo, Japan), raffinose (RF, Nippon Beet Sugar Manufacturing Co.,Ltd., Tokyo, Japan), powdered Akamoku seaweed (AK, Sargassumhorneri), hydroxypropyl starch (HPS, Matsutani Chemical Industry Co.,Ltd., Itami, Japan), hydroxypropyl distarch phosphate (HPDP, Matsutani Chemical Industry Co.,Ltd., Itami, Japan) were used in this study.
The average molecular weight of PHGG is about 25,000 Da. Akamoku is brown seaweed and contains 48% DF on a dry matter basis, determined using the enzymatic-gravimetric AOAC method (AOAC 985.29).
2.2 Animals and diets
This study was approved by the Laboratory Animal Care Committee of Osaka-Aoyama University. Rats were maintained in accordance with the Guidelines for the Care and Use of Laboratory Animals of Osaka-Aoyama University. Rats were housed individually in screenbottomed, stainless steel cages in a room maintained at 23±1°C with a 12 h light-12 h dark cycle (light, 0700–1900 h).
2.3 Experiment 1
Nine-week-old, male Wistar rats (n=60, Japan SLC, Hamamatsu, Japan) weighing 200-220 g were acclimated by feeding a commercial solid diet (Roden Lab, Diet EQ; PMI International, Brentwood, MO, USA) for 7 d. After acclimation, rats were randomly divided into 10 groups (n=6), and allowed free access to one of the following test diets for 21 days: fiber-free diet without cellulose,based on AIN93G (FF diet), FF diet with 5% (w/w) DF (CL, BF, AK, GG, PHGG, KM, BF, HPS, HPDP orRF) (Table 1). Body weight and food intake were recorded daily for each rat in the morning before the food was replaced.
The viscosities of KM, GG and PHGGwere measured at shear rates (1~400 s−1) with a rotational cone-plate viscometer (model RE; Toki Sangyo Co. Ltd., Tokyo, Japan). All viscosity studies were carried out at 37°C.
2.4 Experiment 2
Nine-week-old, male Wistar rats (n=48, Japan SLC, Hamamatsu, Japan) weighing 200-220 g were acclimated by feeding a commercial solid diet (Roden Lab, Diet EQ; PMI International, Brentwood, MO, USA) for 7 d. After acclimation, rats were divided into two groups (n=18 and n=30). Rats in the first group (FF group) were fed the FF diet for 40 days. Rats in the second group were fed the PHGG diet for 20 days before they were divided into two groups (n=12): one group (n=12) (PHGG group)was fed the PHGG diet for a further 20 days and the second group (n=12) (PHGG-FF group) were fed the FF diet fora further 20 days. Six rats from each group were killed to collect blood from the portal vein and the abdominal aorta at day 20, 30 and 40 after feeding each test diet.Body weight and food intake were recorded daily for each rat in the morning before the food was replaced.
2.5 Sampling and analyses
2.5.1 Plasma active GLP-1 and PYY concentrations and DPP-4 activity
At the end of the experiment, rats were anesthetized with pentobarbital (40 mg/kg body weight, Nembutal, Abbot Laboratories, North Chicago, IL) 3h after lights off.
Portal vein blood and abdominal aortic blood samples were collected into cooled EDTA tubes containing apportioni (NPEA0205, NIPRO, Osaka, Japan) with Dipeptidyl peptidase-4 (DPP- 4) inhibitor (EMD Millipore Co., Ltd., Germany) to measure plasma GLP-1 and PYY concentrations. Abdominal aortic blood was also collected into cooled EDTA tubes containing aprotinin without DPP- 4 inhibitor to measure plasma DPP-4 activity. Plasma was separated by centrifugation at 1400 × g at 4°C for 15 min, and stored at -80°C until analysis. After blood collection, the cecum was removed and weighed, and the contentsof the cecum was transferred into a preweighed tube. Subsequently, the cecal wall was flushed clean with ice-cold saline, blotted dry on filter paper and weighed. The adipose tissue, including epididymal and mesenteric fat, were removed and weighed.
The concentrations of active GLP-1 (7-36) and total PYY in the portal vein and abdominal aortal vein plasma were measured using commercially available ELISA kits (Active form Assay Kit-IBL, Immuno-Biological Laboratories Co. Ltd., Gunma, Japan and Mouse/ Rat PYY ELISA kit, Wako Pure Chemical Industries, Ltd., Osaka, Japan, respectively). DPP-4 enzyme activity in abdominal aorta plasma was measured using a commercial kit (DPPIV Drug Discovery Kit, Global Headquarters Enzo Life Sciences Inc., NY, USA).
2.5.2 Profile analysis of cecal microbiota by PCR-denaturing gradient gel electrophoresis
DNA was extracted from the cecal contents using a fecal DNA isolation kit (QIA amp® DNA Stool mini kit; QIAGEN Inc.) according to the manufacturer’s instructions. DNA samples were used as a template to amplify fragments of the 16S rRNA gene with the universal primers 341F-GC (5’-CGCCCGCCGCGCCCCGCGCCC GTCCCGCCGCCCCGCCCGCCTACGGGAGGCAGCAG-3’) and 907R (5’-CCGTCAATTCMTTTRAGTTT-3’)[11]. PCR reaction mixture (20 μL) contained 0.25-μmol amounts of each primer, 2.5mM concentrations of each deoxyribonucleotide triphosphate, 2μL10×buffer, 20mM tetramethylammonium chloride, 0.1μL of TaKaRa EX Taq (Takara Bio Inc.), and 1 μl of DNA solution. The amplification program was 95°C for 5 min; 18 cycles of 94°C for 1 min, 65°C for 1 min, and 72°C for 3 min; 10 cycles of 95°C for 1 min, 55°C for 1 min, and 72°C for 3 min; and finally 72°C for 7 min. Denaturing gradient gel electrophoresis (DGGE) was performed with DCode unuversal mutation detection system (Bio-Rad Laboratories) as the following modifications: the gel contained a 20 to 50% gradient of urea and formamide increasing in the direction of electrophoresis. The migration was 50°C, 150V and 5 hours. DGGE image were compared with FPQuest software (Bio-Rad), and similarities were expressed with Dice’s similarity coefficient.
2.6 Statistical analysis
All data are presented as mean±SEM. Data were analysed by one-way ANOVA, and significant differences among means were discriminated by theTukey–Kramer test. Differences were considered significant at P< 0.05.
3. Results
3.1 Experiment 1
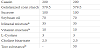
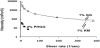
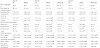
The concentrations of GLP-1 in portal vein plasma in rats fed the GG, PHGG and RF diets were significantly higher than those in rats fed the FF, CL, KM, HPS, HPDP and AK diets (Table 2). The concentrations of PYY in portal vein plasma in rats fed the GG, PHGG and RF diets were significantly higher than those in rats fed the FF, CL and AK diets (Table 2). Comparing the viscosity on water soluble DF, GG and KM was higher than PHGG (Figure 1). However, in rat fed PHGG diets was highest GLP-1 and PYY in portal vein plasma. The weight of cecal tissue in rats fed the GG, PHGG, KM and RF diets were significantly higher than those in rats fed the FF, CL, BF, HPS, HPDP and AK diets (Table 2). There was a significant positive correlation between the weight of cecal contents and the weight of cecal tissue (r=0.7468, P=0.0099). The amount of SCFA in the cecal contents in rats fed the BF, GG, PHGG, KM, HPS, HPDP and RF diets were significantly higher than those in rats fed the FF and CL diets. The concentrations of GLP-1 and PYY in the portal vein plasma increased with increasing amounts of SCFA in the cecal contents (r=0.6237, P=0.0540 for Figure 2a and r=0.6409, P=0.0425 for Figure 2b). There was a significant positive correlation between the concentration of GLP-1 and PYY in theplasma of portal vein blood (r=0.9269, P=0.0001, Figure 2c).
3.2 Experiment 2
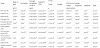
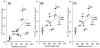
The concentrations of GLP-1 and PYY in portal vein plasma in the PHGG group were significantly higher than those in the FF group (Figure 3a and Figure 3b). The concentrations of GLP-1 and PYY in abdominal aorta plasma were almost similar to the concentrations in portal vein plasma. Not only the concentrations of GLP-1 andPYY, but also cecum tissue, content and SCFAs in the PHGG-FF group, which switched from the PHGG diet to the FF diet on day 20, decreased to the same concentration as that measured in the FF group (Table 3). DPP-4 activity was unaffected by diet and feeding period (Table 3).
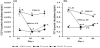
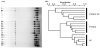
On the basis of the PCR-DGGE profiles on day 30, the similarity in the cecal bacteria population of the FF group and the PHGG group was 53% (Figure 4a and Figure 4b). The similarity in the cecal bacteria population of the PHGG-FF group and thePHGG group was 30%, indicating that the similarity of the microbial population among the 3 groups was low. On the basis of the PCR-DGGE profiles on day 40, the similarities in the cecal bacteria population was also low, similar to the results on day 30.
4. Discussion
Although these experiments were not designed to study the ferment ability of DF in vivo, the amount of SCFA in rat cecal contents could be considered as a measure of in vivo fermentation. Cellulose is a poorly fermentable substrate [12]. The amount of SCFA in the cecal contents of rats fed AK was almost the same as that in rats fed cellulose, which suggests a poor fermentability of AK. Akamoku contains 48% DF and 35% alginates on a dry matter basis [13]. Alginates are soluble polysaccharides. The amount of soluble polysaccharides is the most important determinant for the fermentability of fiber-rich substrates [14]. Previous studies have reported a high resistance to intestinal degradation of alginates from brown seaweeds [15,16].
Previous studies have shown a highly significant correlation between food intake and body weight gain [17,18]. Both GLP-1 and PYY have been implicated in the “ileal brake” to regulate food intake [19-21].
In rats, administration of either GLP-1 or PYY at doses which were inefficient in reducing food intake when given alone, resulted in a significant suppression of food intake when given in combination [22]. In this study, however, there was no correlation between GLP-1, PYY and GLP-1+PYY concentration in aortic plasma and food intake. One reason for this may be that the amount/concentration of GLP- 1 and PYY produced when the given diet contained5% dietary fiber might be insufficient to reduce food intake.
SCFA have been shown to increase GLP-1 secretion in rodents. SCFA produced from DF fermentation might play a signaling role on both PYY and GLP-1 secretions, since it has been demonstrated that SCFA stimulate PYY and GLP-1 secretion from L cells in rodent models [23]. Fermentable DF and SCFA have been demonstrated to increase L-cell numbers [24]. SCFA produced by bacterial fermentation in the gut can directly influence L cells to enhance the release of GLP-1 and PYY [1]. In this study, there were significant positive correlations between both GLP-1 and PYY concentration in the portal vein and the amount of SCFA in the cecal contents (r=0.8321, P=0.0033 and r=0.7963, P=0.0102, respectively). As shown Figure 1, the amount of SCFA in the cecal contents of rats fed KM was approximately double that of rats fed GG, however both GLP-1 and PYY concentrations in the plasma of rats fed KM were almost the same as those in rats fed GG. The reason for this is unclear at present. Factor other than SCFA might be involved in the secretion of GLP-1.
There were significant correlations between the GLP-1 and PYY concentration in portal plasma and the weight of cecal tissue. Since GLP-1 and PYY are secreted from intestinal L-cells, the increased plasma concentrations must reflect either increased secretory activity per cell or increased number of L-cells. Proglucagon and PYY mRNA expression were up-regulated in the cecum of rats fed resistant starch [25].
Cecal tissue weight significantly increased as the rats were fed resistant starch.Intestinal bacteria easily ferment resistant starches, producing SCFA. Cecal infusion of SCFA stimulated cecal mucosal growth and epithelial cell proliferation in rats [26]. Significant positive correlations were reported between both PYY and GLP-1 and weights of small intestine and cecum in rats fed pectin [18]. Therefore, the increased plasma GLP-1 and PYY concentrations might depend on an increased number of L-cells.
The gel-forming DF, such as KM and GG, would create a viscous environment in the small intestine. The increased viscosity of digesta in the small intestine could result in the prolonged presence of nutrients in the small intestine that, in turn, affects the release of GLP-1 and PYY. Postprandial release of PYY and GLP-1 from L cells results from both nutrient transit in the ileal lumen and neural drive of endocrine cells. The viscosity of KM and GG was higher than that of PHGG, but plasma GLP-1 and PYY concentrations in rats fed KM and GG were lower than that in rats fed PHGG. Schroeder et al. [27] have reported that viscosity had no significant influence on plasma concentrations of GLP-1 and PYY.
Oligofructose and PolyGlycopleX (a polysaccharide that is manufactured by complexing three soluble viscous polysaccharides) decreased plasma DPP-4 activity [26], which leads us to speculate that the fermentation end-products of DF, SCFA, might contribute to the inhibitory effects of soluble fibers to DPP-4 activity [28,29].In this study, however, DPP-4 activity was not decreased by feeding PHGG, though PHGG is easily fermented.
Diet is a major force that shapes the composition of gut microbiota. Microbiota respond to dietary modifications by changing the relative proportions of their community members.The composition of gut microbiota is influenced by DF feeding [30].Animal studies have shown that extreme dietary changes can have significant effects on the composition of intestinal microbiota, because intestinal microbiota respond to dietary change [31,32]. However, on the basis of the PCR-DGGE profiles, the cecal bacteria populations of the PHGG-FF group on day 30 and 40 were lower than the FF group. Inbred mice experiments showed that shifting dietary macronutrients can broadly and consistently alter the gut microbiome within a single day [31,33].
5. Conclusion
The findings of this study show that the secretions of GLP-1 and PYY from L cell in rats fed diets containing various DF are affected by the kind of DF in the consumed diet. The plasma concentrations of GLP-1 and PYY increased with increasing the amounts of SCFA, the products of DF fermentation, in the cecal contents.GLP-1 and PYY plasma concentrations and SCFA concentrations in the cecal contents rapidly responded to the altered diet, but the cecal bacteria population did not.
Competing Interests
The authors declare that they have no competing interests.
Acknowledgments
We wish to thank Dr.YohkoSugawa-Katayama for the kind advice to discussion.
Author Contributions
K.E. was involved in designing the study and wrote the manuscript. M.Y. and R.S. carried out the measurement of viscosity. K.M. and R.S. carried out the measurement of profile analysis of cecal microbiota by PCR-denaturing gradient gel electrophoresis.R.S. carried out the plan of study, summarized the results, and discussed with the other researches the results of the study.
Abbreviations
AK: Akamoku seaweed
BF: Beet fiber
CL: Cellulose
DF: dietary fiber
DGGE: Denaturing gradient gel electrophoresis
DPP-4: dipeptidyl peptidase-4
GLP-1: Glucagon-like peptide-1
GG: Guar gum HPS: hydroxypropyl Starch
HPDP: Hydroxypropyl distarch phosphate
KM: Konjac mannan
PHGG: Partially hydrolyzed guar gum
PYY: Peptide tyrosine tyrosine
RF: Raffinose RS: Resistant starch
SCFA: Short chain fatty acids