


1. Introduction
Childhood obesity has been continuously increasing worldwide. According to the Korean National Health and Nutrition Examination Survey conducted in 2010, the prevalence of obesity in Korean children dramatically increased from approximately 5% to 20% during the last two decades [1] . Childhood obesity is strongly associated with several health conditions, including cardiovascular diseases, cancers, diabetes, high BP, and dyslipidemia. Therefore, the prevention of early onset of obesity is a critical factor to control serious consequences in adults [2] . Various factors including genetic, behavioral, environmental, physiological, social factors, contribute the etiology of obesity [3] . In fact, it was reported that as high as 70 percent of the variation in obesity-related phenotypes is heritable in humans [4,5].
G proteins, heterotrimeric guanine nucleotide-binding proteins, are ubiquitously expressed in human cells and consist of alpha, beta, and gamma subunits [6] . G proteins are in charge of regulating intracellular signal transductioninthe G protein coupled receptors (GPCR) activation andplay a crucial role in diverse physiological processes such as metabolism, satiety, cardiovascular functions, and immune response [7,8]. Therefore,dysregulation of the G-proteins and GPCR is associated with various diseases such as Alzheimer’s disease [9] , hypertension [10] , cancers [11] and endocrine related diseases [12] . In particular, the genetic sequences of GNB3 gene are known to be highly polymorphic, so thatmultiple genetic polymorphisms appear due to its wide array of physiological roles [13] . Among these polymorphisms, the GNB3 C825T polymorphismhas been intensively studied. The GNB3 C825T polymorphism, located in exon 10 of GNB3, has been shown to enhance the activation of heterotrimeric G protein in vitro [14] and has been shown to be variably associated with hypertension and obesity [14-16].
The association of the GNB3 C825T polymorphism with obesity was reported in young German men, Chinese men, African Blacks, and Caucasians [15,17-20], although the allelic frequencies and frequencies of major haplotypes of the GNB3 C825T polymorphism differ by race and sex [21-23]. A recent study on Korean obese women demonstrated that the GNB3 825T allele is associated with greater visceral fat [24] and differentially affects body fat loss by sibutramine treatment of the female obese patients [25] .A low level of HDL is one of the five criteria for the diagnosis of metabolic syndrome [26] . Furthermore, the negative relationship between HDL and the risk of developing ischemic heart disease is well accepted [27,28]. However all HDL is not created equal; among HDL subfractions, the HDL2a, HDL2b, and HDL2c lipoproteins represent cardio-protective subfractions, and HDL3b is associated with increased cardiovascular risk [28,29]. In addition, our previous study demonstrated that small-sized HDL, HDL3b, was associated with increased metabolic syndrome risk factors and closely related to WC, BP, triglyceride (TG), and HOMA-IR in Korean adults [30] . However, the potential interaction of the GNB3 C825T polymorphism with dietary intake, obesity and metabolic syndrome risk factors in Korean children has not been closely evaluated yet.
The objective of the present study was to investigate the potential interaction of the GNB3 C825T polymorphism with obesogenic environments, such as dietary intake, lipid profiles and insulin resistance-related factors, in obesity of Korean children.
2. Materials and Methods
2.1 Study population
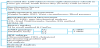
The study participants were recruited from 3rd grade elementary school, aged 8 to 9 years old, in seven elementary schools located in Guro-ku, Seoul, South Korea (Total n=1,260 ; 50.3% boys; 49.7% girls) from April 2007 to May 2008. Informed assent and consent were obtained from the children and parents in accordance with the ethical standards of the responsible committee on human experiments. The study was approved and regulated by the Institutional Review Board of Korea University, Gurohospital(#:GR0837-001). Experimental research design of the present studyis shown in Figure 1.
2.2 Anthropometric, blood pressureand biochemical parameters
Height, weight, andWCwere measured using standardized techniques with calibrated equipment. BMI was calculated as weight/height2 (kg/m2).Gender-specific BMI-for-age in the 2007 Korean National Growth Chart was used to formulate the following categories: underweight was defined as a BMI of lower than 5th percentile, normal weight was defined as a BMI of equal to or higher than 5th percentile lower than the 85th percentile, overweight was defined as a BMI of equal to or higher than the 85th percentile and lower than the 95th percentile, and obese was defined as a BMI of equal to or higher than the 95th percentile of the gender-specific BMI for age in the growth chart [31,32]. In the present study, the obese group (OB) includedthe overweight and obese subjects, and the normal weight group (NOR) included the normal and underweightsubjects.BP was measured using a sphygmomanometer (Baum Co., Inc, South Korea). The subjects were allowed to rest more than 5 min, and subject’s arm was horizontally positioned to measure systolic blood pressure (SBP) and diastolic blood pressure (DBP).Blood samples were collected in the morning after the subjects had fasted for 12 hr. Serum was separated by centrifugation and stored at -70°C until analysis. Total cholesterol (TC), HDL-cand TG concentrations were measured using a Hitachi-7600 analyzer (Hitachi Ltd., Japan),and LDL-cholesterol (LDL-c) was calculated by the Fried wald formula as previously described [33] . Fasting blood insulin levels were measuredusing ECLIA (Electrochemiluminescence immunoassay) and detected by automated immunology analyzer Elecsys 2010 (Roche Diagnostic, UK).
2.3 GNB3 gene polymorphism analysis
The GNB3 gene polymorphism was analyzed using a SNaPshot® multiplex kit according to the manufacturer’s instruction. Briefly, genomic DNA was extracted using the LaboPassTM Blood Mini Kit (Cosmo Genetech, Seoul, South Korea) and stored at -70°C until analysis. The primers used for GNB3 polymorphism analysis were as follows: 5’-GGAGCTGAGAATTGCTGTAG-3 (forward) and 5’-TGTAAAACGACGGCCAGT-3 (reverse). Ten nanograms of DNA was used in the reaction mixture containing 0.5 pM forward/ reverse primer, 1μL of 10X PCR buffer, 250μM dNTP, and 0.25 units of DNA Taq polymerase. The thermocycling procedure consisted of predenaturation at 95°C for 10 min and 35 cycles of denaturation at 95°C for 30 sec, annealing at 72°C for 1min, and extension at 72 °C for 10 min. The amplification was performed using PCR machine (GeneAmp® PCR system 9700, Applied Biosystems, USA), and the results were analyzed by an ABI Prism® 3730xl DNAAnalyzer and GeneMapper 4.0 analysis software (Applied Biosystems, USA).
2.4 HDL particle size andits subfractionanalysis
Samples (Total n=60; 45% boy; 55% girls) from randomly selected subjects were used to analyze HDL particle size and subfraction. Plasma was obtained by centrifugation, and sequential preparation was then performed to collect theHDL fraction (d≤1.21 mg/ml) by ultracentrifugation (Hitachi CS150GXL, Japan). The HDL fraction was analyzed by nondenaturing gradient gel electrophoresis, as described previously [30,34]. Briefly, the electrophoresis buffer contains 90 mM Tris, 80 mM boric acid, and 3 mM EDTA. Prior to the run, the electrophoresis system was pre-run for 20 min at 80 V. Twelve microliters of a sample mix (sample:sample buffer (40% sucrose, 0.01% bromophenyl blue), 2:1) was loaded, and electrophoresis was performed at 100 V for 2 hr, 130 V for 4 hr, 150 V for 18 hr, and 120 V for 2 hr. The gel was fixed with 10% sulfosalicylic acid for 30 min and stained with 0.1% coomassie G-250 for 1.5 hr. The stained gel was destained by destaining solution containing 7.5% acetic acid and 5% methanol and was thenstored in 1% acetic acid solution at 4°C .The Coomassie Blue G-250-stained gels were analyzed with Image-Master ID software 4.0 (Amersham Pharmacia Biotech, USA).
2.5 Assessment of nutrient intake
The parents of the subjects were asked to provide 3-day dietary records (2 weekdays and 1 weekend day). Nutrient analyses of these dietary records were conducted using CAN-Pro 3.0 software (The Korean Nutrition Society, Korea) [31] . Nutrient intake data were adjusted by energy and evaluated based on the Dietary Reference Intakes for Koreans (KDRI).
2.6 Statistical analysis
The data are presented as the mean ± SD. To control for total energy intake, all nutrients were adjusted for total energy intake by using the residual method [35] . A X2-test was used to analyze the allele of GNB3 and its genotype distribution. The mean differences were analyzed by t-tests or analysis of variance (ANOVA). Partial Pearson's correlation coefficients(r) were calculated and x2-tests were performed to determine the relationships among variables. Significance was set at P≤ 0.05.Statistical analysis was performed using SPSS(14.0) for Windows (SPSS Inc., IL, USA).
3. Results
3.1 General participant characteristics
BMI, WC, and SBP were significantly higher in boys than in girls; there was no difference in DBP. TC, TG and LDL-c levels were significantly lower in boys than in girls, but the HDL-cwas significantly higher in boys than in girls (Table 1). There were no differences in insulin resistance-related factors and HDL peak size by gender. Boys appeared to have significantly higher HDL2a subfractions and significantly lower HDL3c subfractions than girls. Energy and nutrient intake, including carbohydrate, protein, fat, sodium and potassium, were significantly higher in boys than in girls. The anthropometrics and metabolic syndrome risk factors, including the lipid profile except for HDL and insulin resistance related factors, were significantly higher in the OB groupcompared to the NOR groupfor both genders.The HDL peak size was smaller in the OB group than in the NOR group.The HDL2b subfraction was more decreased in the OB groupthan in the NOR group, but the HDL3c subfraction was more increased in the OB group than in the NOR group.Energy intake in the OB group was increased mainly due to higher protein intake compared to the NOR group. In girls in the OB group, an increase in fat intake also contributed to the higher energy intake. Sodium and potassium intake were significantly higher in boys than in girls; however, the difference was not observed between the NOR and OB groupsfour both genders.
3.2 Gender difference of anthropometrics, BP, lipid profile, and nutrient intake by GNB3 polymorphism
The genotype frequencies of the GNB3 polymorphism were CC=23.7%, CT=52.1%, and TT=24.2%, and the allele frequencies were C allele=49.7% and T allele=50.3% in the subjects of the present study. There were no significant differences according to gender in the allelic frequencies in obese and normal weight subjects. Boys with the T allele had higher BMI, WC, SBP and TG but lower HDL than boys with the C allele (Table 2).Additionally, the boys with the T allele had significantly higher calciumand phosphorus intake with no significant differences in nutrient sources for energy than the boys with the C allele. Girls with the T allele had lower BMI and WC but higher energy intake and SBP than the girls with the C allele. Inconsistently with the lower BMI and WC in the girls with the T allele, these girls appeared to have higher energy intake than the girls with the C allele, with no significant differences in energy source nutrients or vitamins and minerals.
3.3 Characteristics of the subjects by gender and BMI according to the GNB3 polymorphism
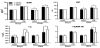
We next determined whether the GNB3 C825T polymorphism further influences the anthropometrics, BP, lipids and insulin resistance-related factors in boys and girls in the NOR and OB groups (Figure 2). Regarding the BMI, WC, and BP, there was no significant difference between the boys with the C allele and the boys with the T allele in both the NOR group and the OB group. However, the girls with the T allele had significantly lower BMI and WC than the girls with the C allele in both the NOR and OB groups. Although there were no significant differences in the anthropometrics related to the GNB3 allele in boys in the OB group, the boys with the T allele in the OB group had higher TC levels than the boys with the C allele in the OB group.The girls with the T allele in the OB group appeared to have significantly higher TC levels than the girls with the C allele, which did not reconcile with their lower BMI and WC. Regardless the GNB3 allele, HOMA-IR levels were higher in boys in the OB group than in boys in the NOR group. The HOMA-IR levels were significantly lower in the girls with the T allele than the girls with the C allele in the OB group in accordance with the lower BMI and WC in the girls with the T allele. Thus, there was a clear gender difference of GNB3 polymorphism in obese children.
3.4 Characteristics of HDL subfractions and insulin resistance related factors by HDL peak size
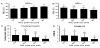
We observed that there were significant alterationsin HDL-clevels and HDL subfractionsby gender and BMI in the Korean children in the present study. To investigate the relationship between HDL peak size and HDL subfractions, as well as insulin resistance related factors in this population, the HDL peak size was divided into quartiles (1st quartile (n=16); ≤8.80, 2nd quartile (n=18); 8.81~9.18, 3rd quartile (n=21); 9.80~10.60, 4th quartile (n=14); ≥10.61). The percentage of the HDL2b subfraction increased as the HDL peak size increased, but the percentage of the HDL3c subfractiondecreased as the HDL peak size decreased (Figure 3 A and 3B).Additionally, fasting insulin levels and HOMA-IR tended to decrease with an increase inthe HDL peak size (Figure 3C and 3D). Furthermore, the HDL peak size and the distribution of HDL subfractions were analyzed based on theGNB3 allele, and there was no significant difference in HDL peak size and HDL subfractions by GNB3 polymorphism in both genders (data not shown).However, we found that the HDL peak size was positively correlated with total HDL-c (r=0.522, p<0.01) whereas the HDL peak size was negatively correlated with BMI (r=-0.449, p<0.01), WC (r =-0.337, p<0.01), and TG (r= -0.349, p<0.01)in our study population (data not shown).
4. Discussion
This was the first international report on the gender-specific interaction of the GNB3 C825T polymorphism with obesogenic environments, such as dietary intake, lipid profiles and insulin resistance-related factors, in obesity of Korean children aged between 8 and 9 years. The frequencies of the 825C and 825T alleles in the samples were 0.497 and 0.503, respectively, which is in agreement with the previously reported values in a Korean adult population [23] . The frequencies were 0.237, 0.521, and 0.242 for the 825C/C, 825T/C, and 825T/T genotypes in the overall study sample, respectively. Compared to the worldwide ethnic distribution of the GNB3 825T allele results for South Koreans (n=31) by Siffertet al. [21] , our result appeared to have lower frequencies of the 825C allele (0.497 vs. 0.560) and higher frequencies of the 825T allele(0.503 vs. 0.440). It is well recognized that the allelic frequencies of the GNB3 C825T polymorphism and frequencies of major haplotypes differ by race [21-23] and sex [24,36].
In the present study, boys weresignificantly heavier than girls based on BMI and WC, partially due to higher energy intake by all three nutrients for energy supply. Although the boys were significantly heavier, the TC, TG, and LDL-c levels were significantly lower than those in girls suggesting Korean boys in the current study are metabolically healthy, although the average BMI was significantly higher than that of girls. This discrepancy of BMI and lipid profile in both genders could be partially explained by different patterns of the HDL subfractions with significantly lower HDL2a and higher HDL3c in girls than those in boys. In addition, our previous study in Korean adults aged average 49.2± 11.5 years demonstrated gender differences in large HDL2b and small HDL3b, HDL3c subfractions [30] .On the other hands, Gracéset al. [37] demonstrated that some metabolic consequences of obesity in Spanish obese children aged 6-8 yearwere similar to those found in adults such as elevated TG, insulin, and HOMA-IR, lower HDL-c, however some features such as blood glucose, TC, LDL-c behaved differently. Thus, it is worthwhile to note that the association of obesity with risk factors including elevated TG, TC, LDL-c, HDL-c, insulin and HOMA-IR may be altered by children age and depends on the chronology of sexual maturation [37] .The anthropometrics, BP, and metabolic syndrome risk factors including the lipid profile, except for HDL and insulin resistance related factors, were significantly higher in the OB group than in the NOR group for both genders. An inverse relationship between HDL particle diameter and TG level has been shown in a previous study [38] , and it was also observed in the present studyby demonstrating significantly higher HDL particle size with lower TG levels in the NOR group than the OB group for both genders.
Multiple studies have demonstrated the association of the GNB3 C825T polymorphism with obesity [16,19-21,39]. However, a few studies did not confirm such an association between the C825T polymorphism and obesity [40,41]. A gender difference in the GNB3 polymorphism was shown in the present study, as evidenced by the boys with the T allele having a higher BMI than the boys with the C allele.There was no significant difference in BMI between the girls with the T allele and the girls with the C allele. A similar trend was observed in German male subjects aged between 58 and 59 years in which the TT genotypes were associated with higher BMI compared to the CC and CT genotypes [36] . Furthermore, the girls with the T allele consumed a significantly higher energy intakethan the girls with the C allele without having different BMIs, whereas no energy intake difference was observed in the boys.
The allelic differences in boys in the NOR and OB groups did not appearin the anthropometrics, whereas the allelic differences of BMI and WC included lower levels in the girls with the T alleles in both the NOR and OB groups. The allelic differences in TC and LDL levels were displayed differentially depending on the BMI status of the boys. We also demonstrated a positive relationship between HDL2b subfraction and HDL peak size and inverse relationships between HDL3c subfraction, insulin and HOMA-IR by HDL peak size in Korean children aged between 8 and 9 years of age. Furthermore, the HDL peak size and the distribution of HDL subfractions depending on the GNB3 alleles did not significantly differ with HDL peak size and HDL subfractions according to GNB3 polymorphism in both genders.
The limitations of the study included the following; (1)it was difficult to collect data for 3 days of 24-h diet recalls by students aged 8 -9 yearsand (2) a lack of blood samples from subjects limited the number of samples to perform HDL subfractionanalysis as well as a high cost of performing the analysis.Nevertheless, we believe this study is the first to show gender-specific interaction of the GNB3 C825T polymorphism with obesogenic environments, such as dietary intake, lipid profiles and insulin resistance-related factors, in obesity of Korean children aged between 8 and 9 years.In conclusion, the results of the present study showed that the boys tended to be heavier than the girls in terms of BMI and WC, although lipid profiles were more favorable compared to those of the girls. Moreover,the T allele of GNB3 C825T was associated with the characteristics of the obesityrelated phenotype, including increased BMI, WC, SBP, DBP, and TG, as well as decreased HDL-c, compared to the C allele only in the boys.
Acknowledgments
This study was supported by the Korean Food & Drug Administration (11162KFDA162) and the National Research Foundation of Korea grant funded by the Korean government(MSIP) (2014R1A2A1A11049611/1).We thank the principals, teachers in charge of the third-year classes, the nursing and nutrition teachers in the seven elementary schools (Dongguro, Gocheck, Gowon, Kaemyoung, Maebong, Onsu, Youngseo) located in Guro-gu, and medical doctors in Guro-gu Public Health Center run by the Ministry of Health and Welfare. We also thank the more than 30 students of the Department of Food and Nutrition in SungshinWomen’s University who participated in the study as surveyors.
Abbreviations
BMI: Body Mass Index, DBP: Diastolic Blood Pressure, FBS: Fasting Blood Sugar, GNB3: G-protein b3 subunit, GPCR: G protein coupled receptors, HDL: High-density Lipoproteins (HDL), HOMA-IR: Homeostasis Model Assessment of Insulin Resistance, LDL: Low-density Lipoproteins, NOR: Normal and underweight group (NOR), OB: Overweight and Obese Group, SBP: Systolic Blood Pressure, SNP: Single- Nucleotide Polymorphism, TC: Total Cholesterol, TG: Triglycerides, WC: Waist Circumference