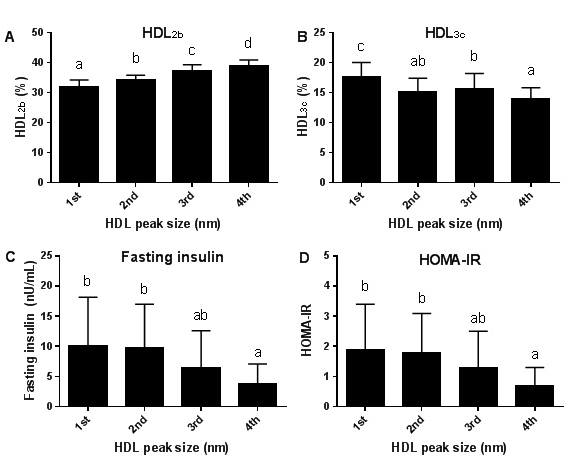
Figure 3: Characteristics of HDL subfractions and insulin resistance related factors by HDL peak size. Data are represented as the mean ± SD (error bars) adjusted by energy; 1st quartile (n=16); ≤8.80, 2nd quartile (n=18); 8.81~9.18, 3rd quartile (n=21); 9.80~10.60, 4th quartile (n=14); ≥10.61. The significance differences were analyzed by ANOVA (p<0.05) and are expressed as a lowercase letter.