


1. Introduction
Due to their potential for practical application, hydrogen storage properties of alloys in the Ni-rich corner of the La–Mg–Ni ternary system were extensively studied, such as CaCu5–type LaNi5 (AB5), PuNi3-type (La,Mg)Ni3, Ce2Ni7-type (La,Mg)2Ni7, and Pr5Co19- type (La,Mg)5Ni19 [1–3]. These alloys that have layer structure of [LaMgNi4] and [LaNi5] units alternatively stacking along c axis [4–6] were expected to have the comprehensive properties of the AB2-type and AB5-type alloys, i.e. large hydrogen storage capacity and fast hydriding/dehydriding (H/D) reaction rates. For example, Nakamura et al. [6] identified that the La4MgNi19 transformed to La4MgNi19H24 after absorbing hydrogen by in-situ X-ray diffraction and neutron powder diffraction. Férey et al. [7] concluded that the La4MgNi19 exhibited a much higher reversible hydrogen storage capacity than La5Ni19. Liu et al. [8] reported that (La,Mg)5Ni19 multiphase alloy showed a good cyclic stability and 89% hydrogen capacity remained within 30 H/D cycles under 5 MPa. Kadir et al. [9] first identified that the LaMg2Ni9 alloy had layer structure stacking from the MgNi2 Laves-type alternating with LaNi5 layers. Denys et al. [10] reported that the reversible hydrogen storage capacities of La3−xMgxNi9 (x=0~0.67) increased with the rise of Mg content. The hydrogen storage capacity of LaMg2Ni9 was 0.33 wt.% H/M at 303 K under 3.3 MPa H2 [11]. Liu et al. [12] improved the cycling stability and the maximum high rate dischargeability of La0.75Mg0.25Ni3.5 by annealing treatment.
The theoretical model is one of the most useful methods for studying the hydrogen storage properties, including the PCI curves and the kinetics, which are keys for application. Assuming that the metal-hydrogen system was univariant, Lacher et al. [13] interpreted the PCI curve of Pd–H system. Later, Beeri et al. [14-16] revised the Lacher-type model by applying Bragg-Williams and the Quasi- Chemical approximations and derived the PCI curves, considering the situations of real gas and the existence of multiple plateaus. Senoh et al. [17] interpreted the PCI curves theoretically based on statistical mechanics, in which the RNi5 (R = La, Pr, Nd and Sm)–H was regarded as a grand canonical ensemble. Lexcellent et al. [18] modeled the anhysteretic PCI curves, discussed the plateau or slope in detail, and finally applied it in the La–Ni-based alloys. Ledovskikh et al. [19] divided the PCI curves into three parts and derived their theoretical models individually by adopting the macroscopic thermodynamic equation and statistical theory of entropy. Unfortunately, the models cannot work well in the La–Mg–Ni ternary system.
As the kinetic models describing the H/D reactions are concerned, numerous models were proposed to elucidate the mechanism of the gas-solid kinetics for hydrogen storage materials. The 41 typical kinetic models were summarized in Ref. [20], among which the Jander model and Johnson–Mehl–Arvami (JMA) model were usually used to describe the H/D kinetics [21,22]. Many other models were reported, for example, on the basis of shrinking core model, Smith et al. [23] deduced a model for describing the kinetics of the LaNi5-xCox, in which the chemical reaction at the α–β interface was likely the rate-controlling step. Blanco et al. [24] supposed that only one step controlled the hydrogen absorption reaction, with other steps in the equilibrium state. They gave out the kinetic expressions of each controlling step and applied them to the La–Ni–Sn system. In recent years, Chou et al. [25,26] introduced the concept of characteristic time and proposed a new kinetic model which described the kinetics of different hydrogen storage alloy systems quite well [27–29]. Later, Chou also proposed a new model to describe the isothermal oxidation of metals and alloys in the form of sphere, flat plate and fiber shape with considering oxidation induced volume change [30].
In this work, on the basis of the more realistic physical assumptions, a model for PCI curves from the view of thermodynamic statistic as well as a kinetic model with the consideration of hydrogen-induced volume change is proposed for describing the hydrogen storage properties. The results of the models are compared with measurements on La20.5MgNi78.5 and La15.5Mg6Ni78.5 alloys, which are selected according to the updated La–Mg–Ni phase diagram in our previous work [31].
2. Theoretical and Experimental Description
2.1 Statistic thermodynamic model
Based on the statistical thermodynamic theory, the present paper divides the PCI curve into three parts, i.e., α, α+β and β regions. It concerns the fugacity factor of real gas and proposes a new model to interpret the PCI curve. The derivation is summarized as follows.
The present paper adopts the hypothesis of Ledovskikh et al. [19], assuming that a hydrogen storage alloy particle consists of M unit cell, and each unit cell have d host sites. Therefore, the total number of vacancies (N) and H atoms (n) for the α, α+β and β regions can be expressed as
where nmax is the maximum number of the H atoms, nα and nβ are the number of the H atoms in the α and β phases respectively, xα and xβ stand for the fraction of H atoms in the α and β phases respectively, dα and dβ represent the host sites per unit cell in the α and β phases respectively, generally dβ≥dα. The structures of LaNi5, LaMg2Ni9 and La4MgNi19 are hexagonal before and after hydrogen absorption, therefore, d=dβ/dα=1. The footnotes of α and β represent the parameters in α and β phases, respectively.
According to the Bragg-Williams approximation, the H atoms occupy the vacancy randomly. The energy for hydrogenation process consists three parts [19], the energy of absorbed hydrogen in the α phase and β phase, represented by Eα and Eβ, respectively; the interactive energy between the two H atoms in the α phase (χαα), β phase (χββ) and α+β phases (χαβ); and the contribution of each unit cell to the total energy for the α and β phases, denoted as Lα and Lβ, respectively. Based on the mean-field approximation, the Hamiltonian (U) of the entire system is expressed as Eq. (3)
Further, the partition function (Ω) is written as
Each point on the PCI curves was under the equilibrium state and the volume of sample holder didn’t change during the measurement. Therefore, the Helmholtz energy is adopted to descript the energy change, as Eq. (5)
where K is the Boltzmann constant. According to the Stirling approximation, Eq. (5) can be written as
Since the PCI measurement is regarded as at the equilibrium state, the chemical potentials of H in the metal and gas are equal. Therefore,
where μ(H/M) and
As for α, α+β and β, the chemical potential of H atom in the metal can be express as:
The chemical potential of H2 under a high pressure is written as Eq. (9)
where P° is the standard pressure, at the value of 105 Pa;
Therefore, the PCI curves can be described by the following equations,
For the α phase region:
For the mixing of α and β phase region:
For the β phase region
where xα, xβ, Eα, Eβ, χαα, χββ, χαβ are the parameters to be calculated using the Eqs.(10)–(12);
2.2 Kinetic model
Great deals of models were reported for the description of the kinetics of the H/D processes in the past years. In recent years, Chou model was provided to describe and predict the kinetic mechanism of the gas-solid reaction, including physisorption, chemisorption, surface penetration, diffusion of hydrogen atoms in hydride and chemical reaction. In most cases, the diffusion and surface penetration are the rate-controlling steps [25,26], and they have been successfully applied in many hydrogen storage alloys [27–29]. Actually, the alloy particle volume will be increased after hydrogenation reaction, compared with the gas-solid reaction in oxidation of metal and alloy, the technique word of “the difference between the volumes of matrix and oxide layer” can be expressed as the Pilling–Bedworth Ratio, which was firstly noticed by Pilling and Bedworth in 1923 [32]. Therefore, we take account of hydrogen-induced volume change, i.e. Pilling–Bedworth Ratio, and propose a new kinetic model in the present work. Assuming that the hydrogen atoms diffuse through the hydride product layers stably, then the rate-controlling step is diffusion; the hydrogen storage alloy particles are spheres with the same density and diameters; the hydriding reaction proceeds from the outer to the inner and the hydride layers are continuous with metal and hydride contacting completely.
Define that the RPB is the ratio of the hydride volume and the unreacted metal volume, expressed as
where η is Pilling–Bedworth Ratio; Mβ and ρβ are the amount and the density of the hydride; Vhydride is the volume of the hydride produced by the reaction; Vunreacted metal is the volume of the unreacted hydrogen storage alloy particles.
Based on the diffusion expression of the Chou model and Valensi- Carter model [25,26,33], the kinetics can be expressed as Eq. (14).
where η ≠ 1. ξ is the reacted fraction of absorbed hydrogen; t is
the reacted time; T is the reacted temperature;
Characteristic time (tc) was first proposed by Chou et al. [25,26], whose physical meaning is the required time to complete the hydriding reaction. So define
Substituting Eq. (15) into Eq. (14), the Eq. (16) is obtained.
When t = tc, ξ = 1. So the smaller value of tc is, the faster the reaction rate will be.
In the Chou model, when diffusion is the rate-controlling step, the expression is
From Eq. (17), ξ is larger than 1 after the reaction is completed, i.e. t > tc, ξ>1, which deviates from the actual experimental results.
According to Eq. (14),
If ξ"=1. ξ=1 From Eq. (18), it can be seen that when ξ"<0 , ξ ≠ 1. Therefore, ξ = 1 is not the inflexion of Eq. (18), which indicates that there is no inflexion in the curve. Obviously, the modified model not only considers the RPB, but also describes the experimental results more accurately.
2.3 Experimental details
According to the thermodynamic description of the La–Mg– Ni system [31], two alloys, composition very close to nominal La20.5MgNi78.5 (labeled as sample #1) and La15.5Mg6Ni78.5 (labeled as sample #2), locating at the LaNi5 & (La,Mg)5Ni19 and LaNi5 & (La,Mg)Ni3 binary zone, were selected and synthesized from the bulk of La (99.99 %), Mg (99.99 %), and Ni (99.999 %) using a medium frequency induction furnace. Before melting, the induction furnace was vacuumed to lower than 10 Pa and then injected with high purity argon (99.999 %) to 0.1 MPa. It is difficult to control the content of Mg in the alloy due to its evaporable property. In order to reach the target composition, we melt the alloys by the following steps. First, melt the refined La and Ni together at around 1600 K to make master alloy in a copper crucible which was cooled by the cooling water for the whole melting process. Second, put the Mg and master alloy together, melt them and weight the finished alloy. If the weight of finished alloy was lower than the weight of target alloy, we would add more Mg based on its burning loss rate and remelt the alloy. Contrarily, if the final weight is larger than the target alloy, the alloy should be kept at high temperature for Mg evaporation to the target weight. In order to make the composition more uniform, we turn around the melt at least three times during the melting process. The composition of target alloys was analyzed by Optima 7300DV ICP. The actual compositions are La19.90Mg1.79Ni78.31 and La15.14Mg6.30Ni78.56, respectively, close to their nominal composition.
The finished alloys were grinded into powder of ~300 mesh in a glove box for the XRD analysis. The XRD measurements were carried out on a DLMAX–2200 diffractometer (CuKα radiation, 10° ≤ 2θ ≤ 90°, 2°/min) operated at 40 kV and 40 mA. The Materials Data Inc. software Jade 5.0 and a Powder Diffraction File database were used to analyze the XRD patterns for phase identification.
Diffraction File database were used to analyze the XRD patterns for phase identification.
As for the H/D analysis, the target alloys were also grinded into powder of ~200 mesh in a glove box. About 1.5 g alloy powders were set in a volume calibrated sample holder. The powders were fully activated by repeated hydriding at 363 K under 4MPa H2 for 30 min and dehydriding at 303 K in vacuum of 10 Pa for 30 min for ten times. The PCI curves and kinetics were investigated by a Sieverts type volumetric equipment under high purity hydrogen (99.999%) atmosphere at 303, 318 and 333 K after completed activation. The hydriding reaction rates were measured under 2 MPa H2 at the same temperature controlled by a thermostat water bath.
3. Results and Discussion
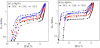
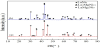
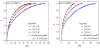
The PCI curves of samples #1 and #2 at 303, 318 and 333K are shown in Figure 1, from which it can be seen that the maximum hydrogen storage capacity of sample #1 (1.41 wt.%H2) is larger than that of sample #2 (1.31 wt.%H2). According to the updated La–Mg–Ni phase diagram [31], sample #1 is composed of LaNi5 and La4MgNi19, and sample #2 contains LaNi5 and LaMg2Ni9. As can be seen in Figure 2, the results of XRD patterns are agreed with the calculated phase diagram. However, only one plateau is observed in Figure1(a), and Figure 1(b). From Figure 2, the amount of LaNi5 is obviously larger than those of La4MgNi19 and LaMg2Ni9 for both sample #1 and sample #2, respectively. Moreover, the plateau pressure of LaNi5 is closed to those of La4MgNi19 and LaMg2Ni9, the plateau pressures of the La4MgNi19 and LaMg2Ni9 are 0.1 MPa at 298 K [9] and 0.3 MPa at 303 K [10], respectively. So it is difficult to distinguish their plateaus from the PCI curves.
The Eqs. (10)–(12) are used to describe the PCI behaviors of the H/D process of the two samples. The PCI curve is divided into three parts and nonlinearly calculated with Eqs. (10)–(12) by least-squares method, respectively. The calculated results are demonstrated as solid lines in Figure 3. All the calculated results have a good consistent with the experimental data, and the r2 values of the nonlinear regression equations are all larger than 0.99. Values for the energy of absorbed hydrogen, the interactive energy between the two H atoms and the contribution of each unit cell to the total energy in the according phase are calculated and listed in Table 1.
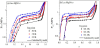
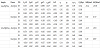
The parameters of xα and xβ represent the end point of the plateau, the difference between xβ and xα represent the length of the plateau, which is another characteristic and property for evaluating the performance of hydrogen storage alloys. Further, the pressure at the middle point of the plateau (Pm) obtained from Eq. (11) is used to calculate the formation enthalpies (ΔH) and entropies (ΔS) of the hydride by Van’t Hoff equation. The values of xα, xβ, xβ-xα, Pm, ΔH and ΔS are also listed in Table 1. The hydrogen absorption enthalpies of the sample #1 and sample #2 are –31.64 kJ/mol H2 and –27.23 kJ/ mol H2, respectively; while the hydrogen desorption enthalpies are 35.02 kJ/mol H2 and 31.39 kJ/mol H2, respectively. In Table 1, it can be found that the plateau length of sample #1 is shorter than that of sample #2, which might be ascribed to the different properties of La4MgNi19 and LaMg2Ni9. The hydrogen absorption behavior is well illustrated by the modified Chou model, Eq. (16), as the solid lines shown in Figure 4(a) and Figure 4(b), which show a good consistent with the experimental data. It can also be concluded that, the rate-controlling step in H/D reactions for the two samples is the hydrogen diffusion in hydride. Both the characteristic time and RPB are calculated from the experimental data. With the increasing temperature from 303 to 333 K, the characteristic time of sample #1 rises from 58.42 to 97.70 s, which is corresponding to RPB values of 1.10 and 1.49, while that of sample #2 increases from 38.09 to 91.14 s with RPB growing from 1.70 to 2.56. The characteristic time of sample #1 is larger than that of sample #2, suggesting the sample #1 has a smaller hydrogen absorption rate. Considered the obtained values of RPB, the La15.5Mg6Ni78.5 hydride has a larger volume changes compared with La20.5MgNi78.5 alloy after hydrogenation.
On the other hand, one may use another method to clarify the kinetic mechanism of the hydrogen absorption in La20.5MgNi78.5 and La15.5Mg6Ni78.5 through the calculation of activation energy of hydrogen absorption. Define
Substituting Eq. (19) into Eq. (14), then
where Δε is the activation energy. Generally speaking, Δε is regarded as a constant at a certain temperature range, BT as a coefficient.
In the present work, the activation energy is assumed to be a constant at 303~333 K, and then, the experimental data is non-linear fitted using Eq. (20). The predicted results by kinetic model of Eq. (20) were also drawn in Figure 4(a) and Figure 4(b), from which it can be seen that the comparisons between the calculated curves and experimental data of both samples #1 and #2 demonstrate a good agreement with each other. These facts support our model again, which means that the controlling step of absorption in La20.5MgNi78.5 and La15.5Mg6Ni78.5 alloys is hydrogen diffusion in the α phase. The activation energy of sample #1 is calculated to be 31.25 kJ/mol H2, larger than that of sample #2 (24.24 kJ/mol H2), suggesting that sample #1 has a slower hydriding reaction rate. The results from the activation energy calculation are consistent with the calculation for characteristic time.
4. Conclusion
On the basis of the more realistic physical assumptions, a model for PCI curves from the view of thermodynamic statistic as well as a kinetic model with the consideration of hydrogen-induced volume change are proposed for describing the hydrogen storage properties. The calculations of the models are compared with measurements on La20.5MgNi78.5 and La15.5Mg6Ni78.5 alloys and present a good consistent with experimental data. The H/D enthalpies of the sample #1 are –31.64 kJ/mol H2 and 35.02 kJ/mol H2, while for sample #2, they are –27.23 kJ/mol H2 and 31.39 kJ/mol H2, respectively. A modified Chou model is deduced on the account of hydrogen-induced volume change. The hydrogenation activation energies are calculated to be 31.25 and 24.24 kJ/mol H2 for samples #1 and #2, respectively. The results indicate that the hydrogen diffusion in the α phase is the controlling step of absorption in La20.5MgNi78.5 and La15.5Mg6Ni78.5 alloys.
Competing Interests
The authors declare that they have no competing interests.
Acknowledgments
The authors gratefully acknowledge support for materials analysis and research from Instrumental Analysis and Research Center of Shanghai University.