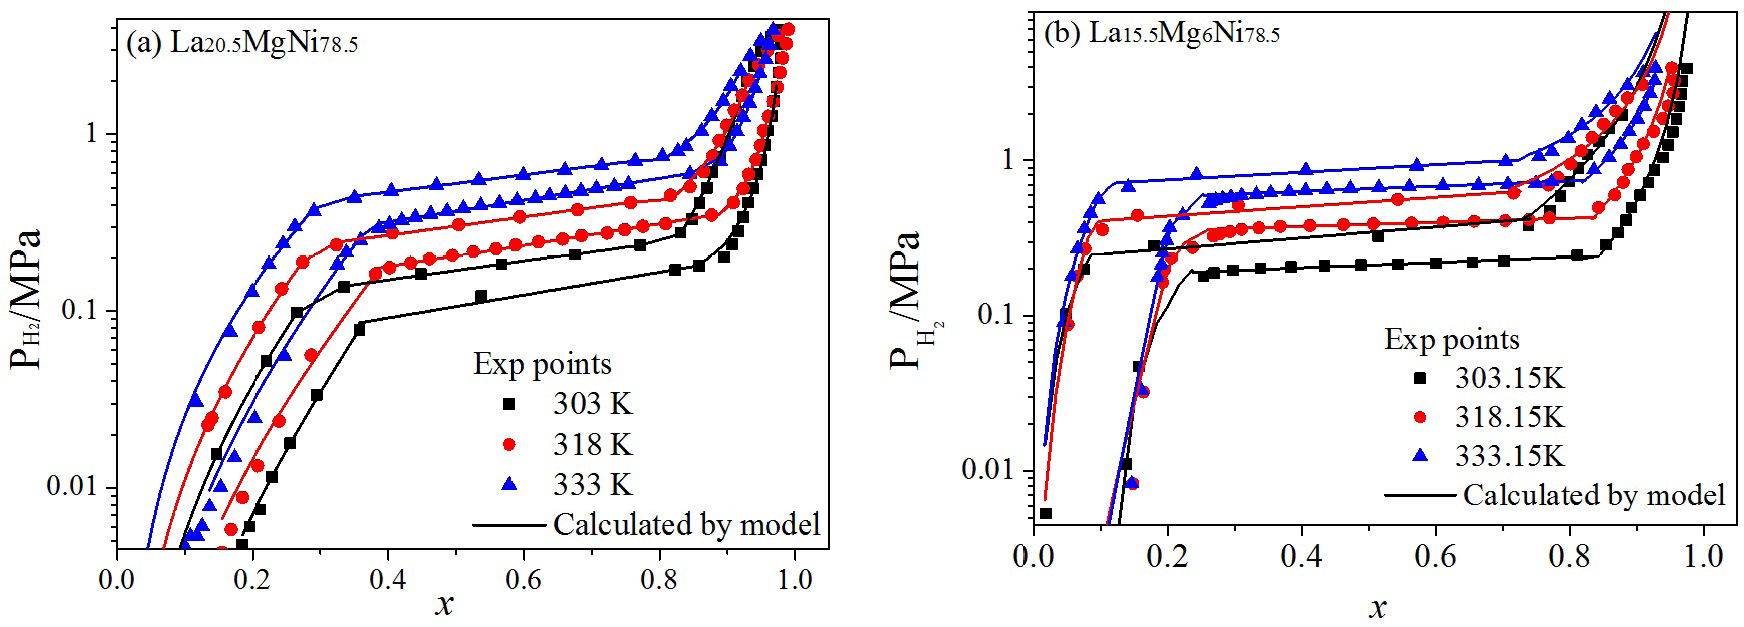
Figure 3:
A comparison between the calculated PCI curve (solid lines) and their experimental data (points) for La
20.5
MgNi
78.5
(a) and La
15.5
Mg
6
Ni
78.5
(b) at different temperatures.