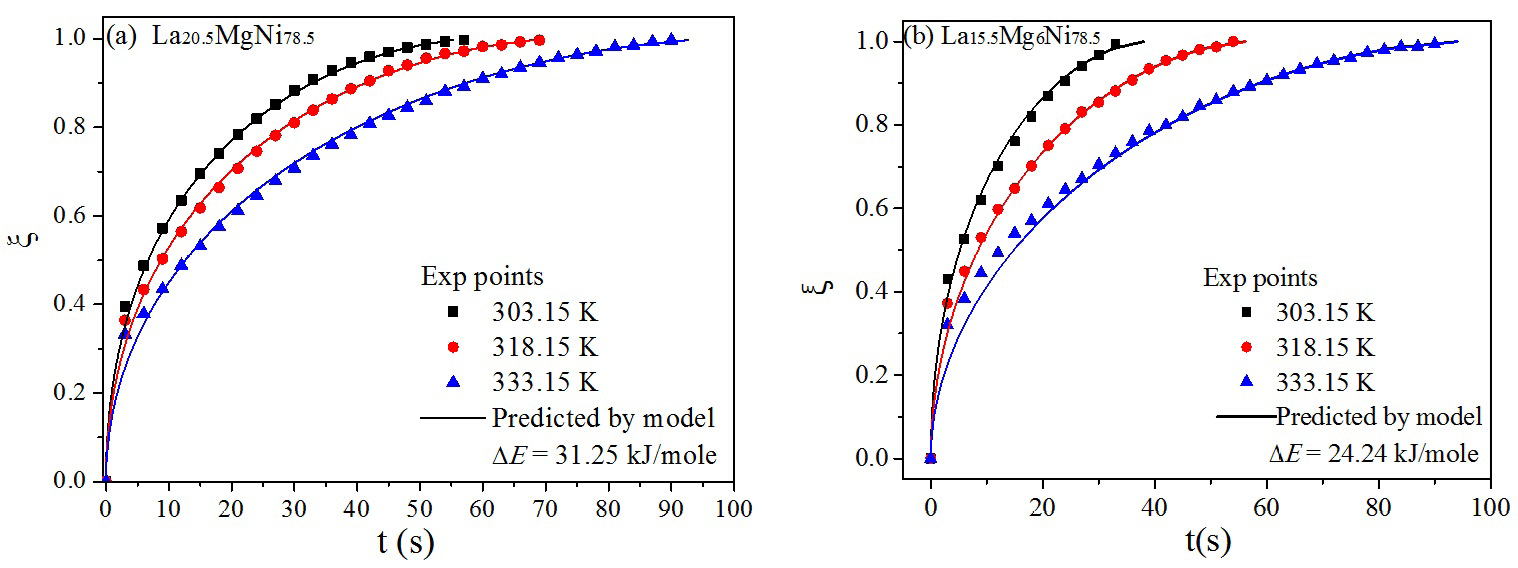
Figure 4: A comparison of transformed fraction (ξ) between experimental data (points) and theoretical prediction (solid lines) for hydrogen absorption in the α phase region for La20.5MgNi78.5 (a) and La15.5Mg6Ni78.5 (b) at different temperatures.