


1. Introduction
Currently, the widespread use of terrestrial laser scanners (TLSs) denotes its potential in several fields of application. This technology is used to three-dimensional (3D) reconstruct objects and scenarios such as industrial machinery parts [1], forest masses [2], landscape disturbances [3], mining [4], buildings [5], road infrastructure [6], geomorphology [7], etc. In archaeology, its use has represented a great advance for the integrity of the reconstructed scenarios and the time invested in documenting the dimensions of each of its elements[8,9].This technology allows to lighten conventional reconstruction devices (total stations, GPS, etc.)and basic instrumentation [10,11]) enabling revisit period for digitalization processes which are usually required in this type of fieldwork. However, a good design of the scanning network is required to fullycover the wholearchaeological areawhich is often characterized by agreat complexity and extension. Several authors have addressed the topic of a good network design from different perspectives: topographic [12,13], photogrammetric [14] and even by using TLS technology [15-19]. However, most of them are mainly focused on engineering [12,13,17,19] or architecture [15,16,18] contexts requiring experts in surveying and geodesy.
In the field of archaeology, it is difficult to find experts in the design of topographic networks that guarantee an optimal and efficient data acquisition. Under this assumption, this paper proposes a semiautomatic planning methodology for the optimum design of the scanning stations inthis type of scenarios. Specifically, a methodology supported by QGIS [20] has been developed in which the design of this network is optimized iteratively based on the digital surface model (DSM). This DSM was generated as a result of a photogrammetric flight executed with a light aircraft (a paratrike) and a digital camera. This manned low-cost system allows us to map complex and large archaeological sites using full frame cameras and accurate navigation systems. This DSM was used because the open and public cartographic information (e.g. LiDAR, orthoimages) does not guarantee enough precision and resolution for this task. In addition, the need for a DSM in archaeology does not represent a problem today, since unmanned aerial systems (UAS) can be used for generating these geomatics products. Routines based on maps of visibility have been implemented allowing the optimization of the minimum number TLS stations required as well as their location.The methodology has been tested in ElTolmo de Minateda archaeological site in Albacete (Spain) to evaluate the quality of the results. In addition, an evaluation of the time savings provided by this methodology is performed, which is endorse by the efficiency of the fieldwork and the quality of the results. In particular, archaeologists do not have to spent time for the determination of the scans locations at the study area, and it is not necessary to perform the pre-processing of the point clouds at field for checking if the scanned areas present hidden areas and enough resolution. Based on authors’ expertise in laser scanning works, we can establish a time saving of 33% in comparison with the classical laser scanning surveying.This is an important factor to take into account in public places with large number of daily visitors.
Within this context, the paper has been organized as follows: After the introduction, materials section is described to carry out the proposed methodology; then the case study as well as the results obtained are outlined; and finally, the paper closes with the conclusions and future works section derived after the development of this research.
2. Materials
Three main geotechnologies were used in this complex archaeological settlement: (i) a paratrike, (ii) a digital camera and (iii) a terrestrial laser scanner.
The paratrike employed was adapted to board several sensors in a stabilized gimbal. The stabilized gimbal maintains the camera orientation aiming to nadir during the flight.
The digital camera used was a full frame reflex camera with a fixed focal length to achieve a ground sample distance (GSD) of 2 cm.
A FARO Focus3D x330 TLS based on the principle of phase shift was used.The support and attachment for the laser scanner was a 3D Super Pro tripod head and a Manfrotto tripod.
The main technical specifications of the three geotechnologies used are outlined in Table 1. Regarding the navigation and geo-referencing system, the planimetric position ofthe paratrike was obtained by a GPS antenna (Trimble Bullet III [23]) connected to a mono-frequency receiver Ublox EVK-6T-0 [24]. The altimetry X was known by the pilot thanks to an altimetric barometer (Digifly VL100 [25]). The absolute precision of this system is ±9 m on the horizontal axis for 95% of the time [26], and ±8 m for the vertical axe.
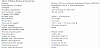
The coordinate reference system was the official coordinate system established by the Spanish law (ETRS89) and the cartographic projection UTM in the 30N zone (EPSG: 25830). This mapping frame was materialized by a GNSS surveying using natural features and photogrammetric targets andestablishedby a GPS-RTK Leica GPS1200 [27] with a precision of 1 cm.
2.1 Case study: design and control of the TLS network in El Tolmo de Minateda archaeological site
The workflow developed and evaluated in El Tolmo de Minateda archaeological site is described in the following diagram (Figure 1).
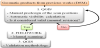
The step 1 consists on a manual predesign of the scans positions using previous generated geomatics products (DSM and orthoimage from aerial photogrammetry process) as input data. Next, the viewshed map from the planned scans positions is computed. This step is supported by a visual analysis considering if the gap percentage and the overlap of views per unit area is enough for the needs of the desired mapping. If the results do not satisfy the established criteria, the planned scans positions are edited (e.g. moving, adding, or removing them) and another visibility calculation is performed. This is an iterative process until the results provide an acceptable coverage (e.g. hidden area percentage) useful for the archaeologists. Then, in the step 2, the fieldwork is executed based on the planned scans positions. Finally, in the step 3 the executed laser scanning surveying is compared with the planned laser scanning surveying using the overlap of visible and hidden areas as validation criterion.
2.2 Study area
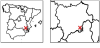
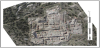
The study area was located in the municipality of Hellín, Albacete (Spain) (Figure 2) where there is a Visigoth archaeological site called El Tolmo de Minateda Archaeological Park that was occupied from the Neolithic period until the end of the 10th century AD. [28].
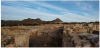
The case study covered the entire archaeological site (3,500 m2) in which various buildings dedicated to worship (basilica and baptistery), residence and administration (episcopal palace) were observed. These remains included a religious construction and other palatial building located in the highest part of the park. In addition, there were numerous concavities carved into the ground as well as cisterns and graves [29] (Figure 3).
2.3 Scanning network design
The planning began with the pre-setting of some scanning stations by the user taking as input the DSM and the orthophoto of the area (Figure 4). In this case, the DSM was obtained from a previous photogrammetric ultralight flight [9] with a GSD of 4 cm. The description of the photogrammetric process and the generation of the DSM and orthophoto exceed the scope of this article and can be found in [9]. The criterion for the predefinition of the scanning network was based on locating the scan positions in the border area taking into account the morphology, especially the height, of the elements present in the scenario (Figure 4).

If the morphology of the remains fits a regular pattern, the network design will be a grid of approximately twice the scanning range (40 m for this case study). In this case,the predominant morphology of the ruins was rectangular so the location of theTLS stations was one that ensured to cover the inner face of each of these structures as well as the adjacent ones.
There are certain areas that can be used to optimize the number of stations, the scanning coverageand to minimize the occlusions. For example, make use of elevated areas as walk ways for visitors or unimpeded areas among others to use them as scan positions. In any case, the proposed methodology is iterative and improves the design of the scanning network as editions and calculations are undertaken. The importance of the initial design relies on the operator's ability to visualize both, the delimitation of the area of interest and the greater obstacles of the scenario.
QGIS VisibilityAnalysis plugin [30] calculates visible surfaces from a given observer point over a DSM. For this calculation, it is necessary to provide the digital terrain or surface model, the layer of the points from which each scan is intended (an initial approximation), the maximum scanning range and the height of the optical center of the TLS.The plugin generates the overlap maps from the established group of points by performing an analysis of their visibility based on the principle of projective geometry [30]. After that, the visibility is represented on the DSM input data and it contains a computation of all the visual basins reached from each pixel of the DSM.
In this case study, the scans were registered into a common coordinate system using calibrated spheres distributed around the archaeological site. Regarding the scanning parameters, they were set to ensure the correct identification of the spheresat a distance of 20 m from the scanner even the maximum range of the equipment was theoretically 330 m. As detailed in [31], the density of the point cloud grows with the number of scans and decreases with distance. A minimum density of the point cloud was achieved within the set threshold. The height of the TLS was designed with the most restrictive parameters and assuming the most unfavourable conditions to establish the minimum conditions that would ensure the required range and quality of the point cloud. Thus, a height of approximately 1.5 m was set which could vary slightly in some stations to avoid obstacles.
As a result, a preliminary design is provided where the amount of overlaps for each point of the area covered is shown. This prior design helps to improve the final one avoiding hidden areas(white areas in Figures 5, 6 and 8) by approaching distant scanning stations or adding new ones in areas with insufficient overlap. This process is iterative until the scan coverage is sufficientfor the entire area of interest (at least 1 scanning coverage with the established parameters per point). The results of the first and last iteration are illustrated in Figure 5 and Figure 6, respectively.
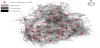
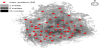
The design obtained after the last iteration (Figure 6) still contained occlusions in the area of interest. However, the scanning network was admitted since theTLS field of view was set at 20 m, an optimal distance for the identification of reference spheres but not to obtain a maximum coverage in the 3D model. In addition, it must be highlighted that the DSM generation process from aerial images did not take into account the exact geometry of the elements being vertically projected; that is the case of elevated walkways. For all these reasons, and taking into account that in the pronounced concavities no spheres were located, this planning was considered valid to begin fieldwork.
2.4 Data acquisition
The fieldwork was carried out accordingto the planning designed. Despite the detail offered by the orthoimage (2 cm GSD), once in situit was decided to slightly modify some scanning stations giving priority to some structures with respect to other as well as to guarantee the safety of the TLS. Figure 7 illustrates the final positions of the scans.
A scanning grid of 6 mm at a distance of 10 m from the scanner was set for the 64 scans performed. Six additional scans complemented the 58 scans planned a priori to improve results regarding possible discontinuities and toensure maximum scanning coverage in those areas of greater interest. For the data processing, SCENE software [32]was used and the scans were grouped by date of acquisition to accelerate this process step. A first relative registration of TLS data was performed by using inclinometers, compasses and GPS. Finally, an absolute registration of the modelwas carried outwith an average error of 2.3 mm. This process was performed by indicating the coordinates of the base of each of the spheres used that were previously measured with the GPS-RTK equipment.
The final model density depends on: (a) the proximity between neighbouring scans and (b) the distance between the surfaces and the scanner. To avoid the redundancy of information in areas where there was a high overlap, a homogenization was performed in terms of decimation. Finally, a uniform and coloured model was achieved since in this case the TLS had an integrated RGB camera for this purpose.
2.5 Planning validation
To validate the methodology, once the model has been registered and georeferenced, coordinates of each scan station were exported by SCENE [32]. As has been described in the section scanning network design, a new map of the overlaps with the executed scanning network was generated. In order to verify if the planning had fulfilled the required quality criteria, the planned and the executed solution were compared (Figure 8). Note that the differences between the planned and the executed scanning network were very similar, and that in the executed networkthere were also hidden areas.
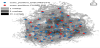
Finally, to ensure consistency between the planning and the execution steps, a comparison of the hidden areas for both cases was performed in terms of an intersection of layers (Figure 9). Some of these differences were due to in situ considerations by the staff responsible for the data collection.

As for the verification of the number of overlaps planned and executed, the result clearly shows that the prediction in the planning map was satisfied for those areas of zero overlap and that the minimum planned work was successful. It was considered that given the extension and complexity of the area, without this previous planning design, the fieldwork could have been delayed as well as the model could have had insufficient coverage in some areas.
3. Conclusions
In this paper, a planning methodology for optimal TLS data acquisitions in complex archaeological environmentsis presented andvalidated for the case study of ElTolmo de Minateda (Albacete, Spain) archaeological site. The final objective of this research is to provide archaeologists with a simple tool and methodology with which they can undertake laser scanner surveys autonomously and with guarantees.
Since methodologies that are currently used to perform TLS data acquisitions in archaeological context are mainly obsolete [10,11] and required experts, it is important to develop a procedure to optimally choose the number of scanning stationsas well as their location [12-19]. All this leads to a significant reduction offield work costs while ensuring quality results.
As future work, it would be interesting to integrate this tool under tablets or smartphones devices that would allow to carry out the planning of such work in a more comfortable and agile way by any user. Also, the automatization of the process would be possible if exclusion enclosures and numeric coverage percentage will be given.
Competing Interests
The authors declare that they have no competing interests.