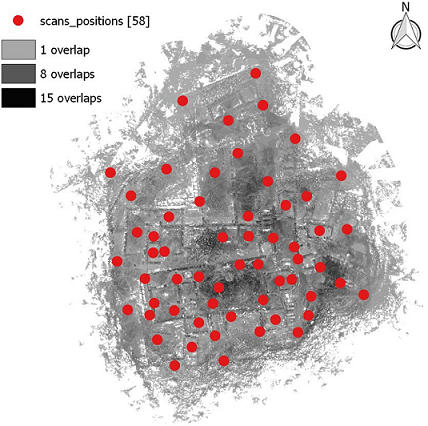
Figure 6:
Scanning network design and density of simulated scanned overlap after the last iteration (4th) with visibility analysis plugin. E: 1:1,200.