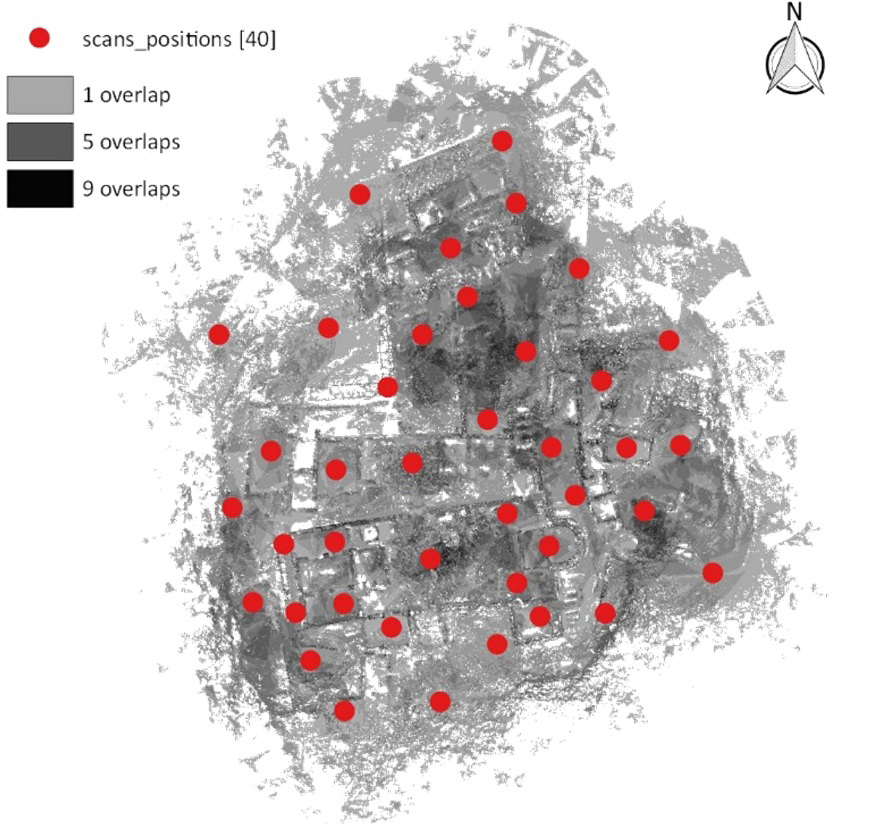
Figure 5:
Scanning network design and density of simulated scanned overlap after the first iteration with viewshed analysis plugin.E 1:1,200.