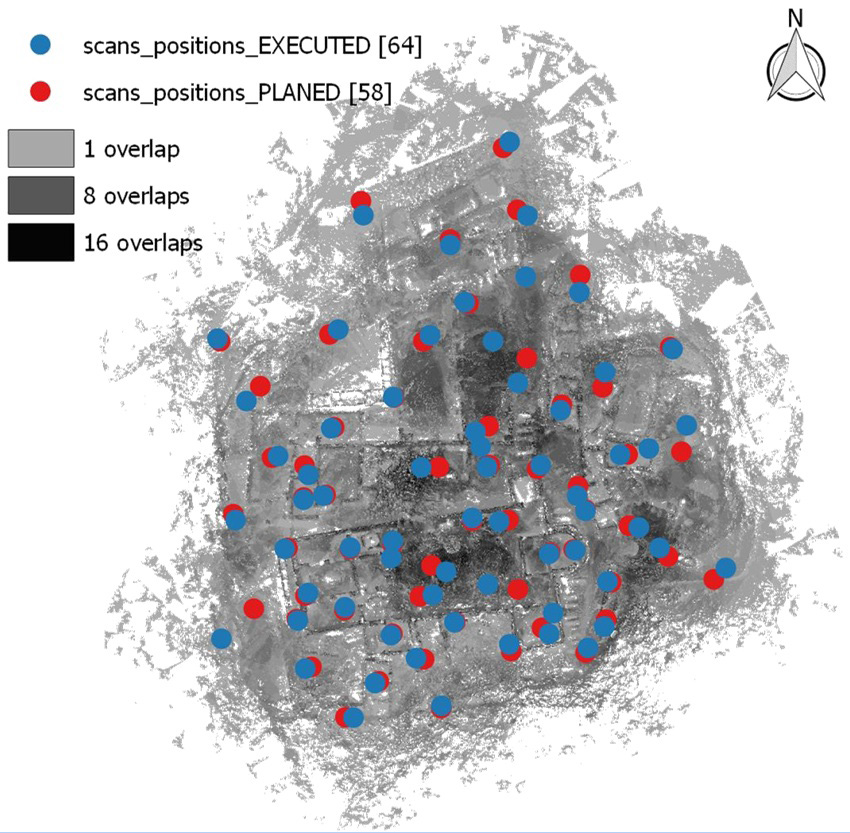
Figure 8:
Comparison between planned and executed TLS scanning networkand density of simulated and executed scanned overlap.E: 1:1,200.