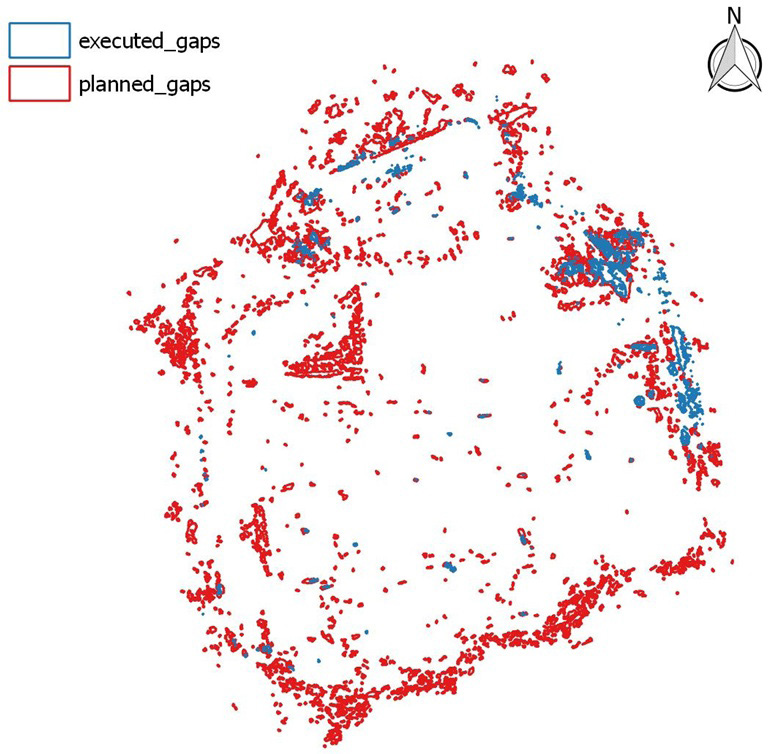
Figure 9:
Non-overlapping scanned areas corresponding to the planned model (red) and the executed one (green). E 1:1,200.