


1. Introduction
Sediments from tidal flats and marshes can record the pollution coming from urban and industrial activities performed in the littoral. These ecosystems are usually quite protected from waves, while tidal currents are the main responsible of sediments’ distribution creating a declining grain-size trend from the distal part (sandy sediments) to land (muddy sediments).The low hydrodynamic energy of these areas favours pollutants’ accumulation in the sediments. For that reason, these fragile sedimentary environments are very sensitive to anthropogenic activities and they have been the target of numerous pollution studies [1-3].
The tidal flat of San Simón Bay (Ría de Vigo, NW Spain) is wellkown by its extremelly high pollution levels of Pb, with concentrations between 500 and 65,400 μg g-1 [4]. This has been proved by many studies [4-14], where it is pointed to an ancient ceramic factory (Pontesa) located in the NE coast of the Bay as the main source of Pb pollution. Sediments of these area are characterized by high organic matter contents that fuel early diagenetic processes [4,7-8]. Despite the great knowledge on Pb pollution in San Simón Bay, this area has been selected for monitoring the historical and diagenetic evolution of Pb in the sedimentary record. In order to achieve this, one option is the use of geochronological methods, suh as those based in 137Cs and 210Pb, to construct a temporal framework [15,16]. The 137Cs dating method is based on the identification of the maximum inputs of this artificial radionuclideto the environment [17,18]: 1986 (Chernobyl) and 1963 (the maximum of nuclear tests). The 210Pb dating method is based on the determination of the in excess 210Pb fraction (210Pbxs) and, afterwards, the adjustment of the activity profile by using an appropriate dating method [19-22]. Another option is to collect sediment cores in the same study area periodically, and then, analyze and compare them. If their analysis is made by conventional techniques this would imply a high number of samples, pretreatment and time-consumption (and cost) for getting results. Then, fast and non-destructive techniques, such as X-ray fluorescence (XRF) scanning with equipments like the Itrax™ Core Scanner (Itrax) would be preferred. This equipment requires very simple sample preparation (i.e. smoothing the core surface) and provide optical and radiographical images, and XRF data obtained in continuous mode at submillimetrical scale in a few hours [23]. Elements’ contents are expressed as peak areas (the area integrals of the elements’ characteristic peaks presented in each spectrum) that are proportional to element concentrations in the sediment. Despite the semi-quantitative nature of the Itrax data, several authors have demonstrated the ability of this kind of scanners to detect metal pollution in sediments, even at low concentrations [16,24-27]. However, we showthe utility of the Itrax for monitoring pollutionover time and as a complementary tool to support radionuclide analyses.
Pollution monitoring not only implies the following of pollution events over time but also the determination of their origin for identifying possible changes in sources. Sources of Pb pollution to the environment can be disentangled by analysing Pb stable isotope ratios, because each source of Pb (natural or anthropogenic) usually has a characteristic isotopic composition [10,28-29]. Anthropogenic Pb inputs are usually less radiogenic than natural sources and their isotopic composition depends on the natural ores used in the different human activities.
The main aim of this work is to follow the temporal evolution of the Pb records of San Simón Bay as well as the diagenetic processes that condition Pb bioavailability. To that end, a comprehensive analysis of sediments and pore waters have been made by applying different analytical techniques including the Itrax as a screening tool to improve the resolution of the results obtained in comparison to those obtained by conventional analyses. Moreover, the Itrax will be proven to be a fast option for sediment pollution monitoring, representing a quick tool for checking the compliance of regional environmental laws that should be integrated in the range of the techniques usually applied in environmental coastal management.
2. Study Area
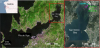
The Ría de Vigo is the southernmost of the Galician Rías (NW Spain). It has a funnel morphology with an area of 176 km2 and an axial length of 33 km. It is 10 km wide at its mouth and it gets narrower towards its head in the Rande Strait. Beyond this zone, the Ría widens again, forming the San Simón Bay which is smaller and shallower than the rest of the Ría. The San Simón Bay is 7.3 km long and 3.5 km wide, taking up an area of 19.5 km2. About one third of it is intertidal, under the influence of a mesotidal regime (2 to 4 m with an average of 2.2 m) [30]. The main source of freshwater is the Oitavén-Verdugo River system (13-17 m3/s), but little sediment has been deposited since the construction of the Eiras dam in 1977 [31]. The San Simón Bay is an area of low hydrodynamic energy due to its orientation and morphology [7,32] and its waters are thermally stratified during most of the year [13]. Sediments in the Bay result from a mixture of marine and terrestrial sources. They are rich in organic matter (7-15%) and poor in carbonates (<1%)[4]. This bay shows a high productivity due to the intense upwelling processes which characterize the western margin of Iberia [33], and which have favored extensive marine cultures in the Galician Rías over the last one hundred years. Therefore, in this bay there are many rafts for mussel cultivation, and gatherers of shellfish collect by hand clams and cockles in the sand banks [7]. Despite the need of preserving the seabed quality, San Simón Bay receives polluting urban and industrial wastes from the sourrounding coastal towns and cities. An extremely severe enrichment by Pb was detected in the intertidal sediments of the bay [4,6]. The main Pb source was interpreted to be aceramic factory (Pontesa) [6,10] located in the NE part of the Bay (near to the Oitavén-Verdugo system)(Figure1b), whose activity took place between 1972 and 2001.
3. Material and Methods
This study is based on two cores collected in October 2010 at the same position close to the old ceramic factory (42°20’48.83’’N; 8°36’50.88’’W) in San Simón Bay (Figure 1b). One core was 26.5 cm long (core designation SS10T01) and its replica, 36 cm long (core designation SS10T03). This replica was intended for radionuclide analysis and water content determination, while the other analyses were performed on core SS10T01. Once in the laboratory cores were half-splitted and pore waters were collected by Rhizon® samplers from core SS10T01. Then, it was extracted a 2 cm wide U-channel from each core, and discrete samples were obtained each1-cm. Analyses on core SS10T01 were made each 2-3 cm, while on core SS10T03, each 1 cm.
Pore waters were divided in three aliquots, one for determining sulphates by Ultraviolet-Visible (UV-VIS) spectrometry in a Hewlett Packard HP 8452A (Limit of detection –LOD- 20 μg L-1); the second for determining sulphides by UV-VIS after adding 0.4 ml of a solution of Zinc acetate 50 mM per ml; and the third, after acidification with HNO3 for determining Pb, among other trace elements, by Inductively Coupled Plasma-Mass Spectrometry (ICP-MS) in a X Series ICP-MS Thermo Elemental (LOD 0.200 μg L-1).
Grain-size was determined in both cores by laser difraction particle size analysis with a Beckman Coulter Counter LS 13 320.
Percentages of total carbon (TC), total nitrogen (TN), total sulphur (TS) and total inorganic carbon (TIC) were determined with a LECO CNS-2000 analyzer in subsamples of core SS10T01. Total organic carbon (TOC) was estimated by subtracting the TIC from the TC, and carbonates percentage was calculated by multiplying the TIC by a stoichiometric factor of 8.33.
The two extracted U-channels were analyzed with an ItraxTM Core Scanner (Itrax) using a Mo-tube, with a voltage of 30 kV and a current of 55 mA. The step size used was 500 μm and the exposure time, 10 seconds. All results were re-evaluated using the Cox proprietary software Q-Spec 6.5.2.
Total concentrations of As, Ba, Co, Cr, Cu, Mn, Ni, Pb, Sr, V and Zn in sediments (core SS10T01) were also obtained from conventional XRF analysis by using a fluorescence spectrometer SIEMENS SRS 3000.
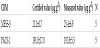
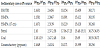
The methods proposed by the National Water Research Institute (Canada) for trace elements [34] were followed to obtain the bioavailable Pb fraction, the recoverable Pb fraction and the total Pb content in sediments. In such away, three replicas for each subsample were procesed using HCl, a mixture of HCl, HNO3 and H2O2, and the former mixture plus HF, respectively. Lead content in the digests, as well as the total contents of several trace elements (Ag, Cr, Cu and Zn, among others) were determined by Inductively Coupled Plasma Optical Emission Spectrophotometry (ICP-OES) using a Perking Elmer Optima 4300DV. Certified reference materials MESS-3 and PACS-2 (NRC, Canada) were analyzed to check for accuracy and precision of total Pb content determination and total recoveries were obtained (Table 1).
Lead stable isotope ratios (206Pb/204Pb, 207Pb/204Pb, 208Pb/204Pb, 208Pb/206Pb and 207Pb/206Pb) were determined in the samples obtained from the different extracts (bioavailable, recoverable and total) by Inductively Coupled Plasma Multi-collector Mass Spectrometry (ICP-MC-MS) using a Thermo-Finnigan Neptune. Selected samples were analyzed after preconcentration using a cation exchange resin (TrisKem International, France) in order to check if there were matrix interferences. Differences in isotopic ratios determination between digested samples and samples preconcentrated after digestion were minimal (on average 0.005%). NIST SRM-997 Tl was used as a spike for mass bias correction. NIST SRM 981 was used to check for isotope relationships accuracy, calibration and isotope correction factors. Precision for 207Pb/206Pb was around 0.01% and for 204Pb/206Pb and 208Pb/206Pb ratios around 0.02% on the basis of two standard deviations (2σ).
Different mixture models were applied to the Pb isotopic ratios for obtaining the total anthropogenic component - TAC-[35], the Pb isotopic signature of the anthropogenic inputs for each depth [35,36] and the apportionment of the Pb anthropogenic sources (considering three possible sources) [37,38]. Details of these models can be checked in Álvarez-Iglesias et al. [10].
Thirty-five sources were counted in an n-type coaxial low-level background HPGe detector (CANBERRA). For details on source preparation, spiking, equipment background and spectra analyses see Álvarez-Iglesias et al. [8]. The specific activities of 210Pb, 214Pb, 226Ra, 137Cs, 234Th, 235U and 40K were determined. Water content was determined in the same samples by weight-loss after drying the samples at 50°C up to constant weight, considering the ratio water/ humid sediment.
All the analytical work was performed at the Central Research Services of the University of Vigo (C.A.C.T.I.) excepting radionuclide analyses, which were performed at the Ionizing Radiation Laboratory of the University of Salamanca.
4. Results
4.1 SS10T01 core
SS10T01 sediments were mostly sandy silts, although some levels of silty sands (at depths of 2 and 7 cm) were observed (Figure 2). Furthermore, significant contents of coarse sands were detected at 7, 23 and 25 cm.
TOC, TN and TS contents decreased downwards, being their profiles very similar. TOC values ranged between 1.06 and 3.14%; TN between non-detectable contents (LOD=0.4%) and 0.27%, and TS between non-detectable contents (LOD=0.15%) and 0.39% (Figure 2).Carbonates were only detected at 17-20 cm (0.10%; LOD=0.05%).
Two distinct facies can be defined for the SS10T01 core (Figure 2). Facies 1 comprises the dark-coloured uppermost 13.5 cm, showing TOC and TS contents larger than 1.5% and 0.2% respectively, and little or none CaCO3. Facies 2 comprises the light-coloured underlying part of the core showing lower TOC and TS contents than facies 1, and a higher CaCO3 content (> 0.5%).
Sulphate contents in pore-waters decreased with depth (from 613 to 58 mg L-1, Figure 2), while sulphide contents were low (up to 250 μg L-1), being non-detectable at 14 and 18 cm (LOD=20 μg L-1). Lead was not detected in the pore-water aliquots (LOD=0.200 μg L-1).
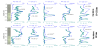
Total Pb contents in sediments were extremely high (17,200-66,700 μg g-1-ICP-OES data; Figure 3). Two levels can be differentiated, an upper level up to 13 cm with a higher Pb content (4.92±1.40%), and a lower level from 13 cm to the bottom of the core, with a lower Pb content (2.09±0.47%). The Pb content variability throughout the sedimentary record can be clearly observed from the Pb Itrax results (20,278-93,435 peak area; Figure 3). A noticeable subsurficial maximum was detected between 7 and 13 cm, with Pb contents higher than 5.2%. At this depth interval, it was also detected relatively high contents of Ag, As, Cr, Cu and Zn (Figure 3). Furthermore, high contents of Cu and Zn were detected at deeper levels (at 18 cm for Cu and at 16 and 24 cm for Zn).
The Pb profiles in the bioavailable and the recoverable fractions were similar to that of the total Pb content, although with lower concentrations (0.29-1.08% in the bioavailable fraction, and 0.83- 4.12% in the recoverable fraction; Figure 4). The bioavailable fraction represented around 18% of total Pb and its contribution increased, in general, with depth, whereas the recoverable fraction constituted around 56% of total Pb and its contribution was maxima between 5 and 13 cm.
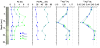
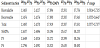
The 206Pb/207Pb, 206Pb/204Pb, 207Pb/204Pb, 208Pb/204Pb and 208Pb/207Pb ratios profiles for the bioavailable and recoverable fractions and for the bulk samples of the SS10T01 core, were similar (Figure 4), with a marked minima at 11 cm. The individual Pb isotopic ratios were also similar between the different fractions (Table 2); with slightly lower ratios in the recoverable fraction, and slightly higher ratios, in general, in the total fraction. For example, the 206Pb/207Pb ratios were 1.1627±0.0048 in the bioavailable fraction, 1.1615±0.0048 in the recoverable fraction, and 1.1632±0.0050 in the total fraction (Figure 4). Subsamples collected at the same depth showed very similar individual Pb isotopic ratios among the different fractions, excepting the deepest samples (from 17 cm).
4.2 SS10T03 core
Sediments of the SS10T03 core were mostly sandy silts, although some levels of coarse sands and silty sands were observed at the bottom of the core (at 32 and 36 cm, respectively). Some levels showed a significant content of coarse sands (at 11, 14 and 32 cm). Facies distribution was the same as in the SS10T01 core (Figure 2) but with an additional layer of coarse sands near the bottom.
Lead contents were in the range of those detected in the SS10T01 core (56,500±21,200 average peak area (p.a.) in front of 57,950±22,320 p.a.; Figures 3 and 5). Two levels can be differentiated, an upper level up to 16.5 cm with a higher Pb content (70,770±11,030 p.a.), and a lower level from 16.5 cm up to the bottom of the core with a lower Pb content (43,530±19,860 p.a.). A big subsurficial Pb maximum was detected between 11 and 13 cm, with an average peak area of 88,100.

Fe and Ti Itrax profiles for the SS10T03 core were very similar (Figure 5): Fe and Ti contents decreased from surficial sediments (~400-700 p.a. for Ti and ~15,000-20,000 p.a. for Fe) up to around 10 cm (~400 p.a. for Ti and ~11,500 p.a. for Fe); then their contents slightly increased downwards (with contents in the same range as the upper sediments), excepting a marked maximum at around 31 cm (~700 p.a. for Ti and ~20,000 p.a. for Fe).
Water content decreased in general from surface (34%) to 30 cm (15%), with a small maximum at 27cm (33%), and then, it increased towards the bottom (where it was about 46%; Figure 5). Its profile was similar in the upper 13 cm to those of Fe and Ti. Previous studies on San Simón Bay sediments [8] showed that water, TOC, Al and Fe profiles were similar among them and that they can be considered as grain size proxies.
Specific activity radionuclides profiles of SS10T03 core showed clearly that grain size influence (Figure 5). 214Pb, 234Th, 235U and 40K profiles were very similar to those of Fe, Ti and water content. The deepest samples of the core showed a marked increase in the specific activities of 210Pb, 214Pb, 234Th, 235U, and 40K, probably related to higher contents of organic matter and fine-grained sediments in these samples. The deepest sample of the core showed a very high 137Cs specific activity. Then, trying to minimize grain size influence, the 210Pbxs and 137Cs profiles were normalized by the Fe content. The normalization did not modify the observed 210Pbxs profile, but it decreased the variability observed in the 137Cs profile, excepting for the deepest samples.
The specific activity of 137Cs varied between 1.08 and 27.66 Bq kg-1 and showed relative maxima at 26 cm and at the bottom of the core (34 cm), while Fe-normalized profile showed relative maxima at 12 cm, 25 cm and at the bottom. Taking into account the high contents of water, Fe and Ti at the bottom, the 137Cs maxima observed at this level is considered to be due to a matrix effect and is not going to be considered as a time-marker. Then, assigning the years 1987 and 1963 to the other maxima observed in the Fe-normalized 137Cs specific activity profile at 12 cm and 25 cm, respectively, sedimentation rates of 5.2 and 5.4 mm yr-1 could be obtained. When the year 1963 was assigned to the maxima observed at 26 cm in the 137Cs specific activity profile, sedimentation rates of 5.5 mm yr-1 were obtained.
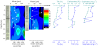
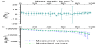
The specific activities of 226Ra varied from 19.52(3.39) to 51.57(8.62) Bq kg-1, while for total 210Pb, from 19.58(2.24) to 109.33(9.22) Bq kg-1. 210Pbxs was detected throughout the core (although several samples showed values close to zero activity), with a marked maximum at the bottom, related to the sediment matrix. The 210Pbxs activity was estimated by subtraction of the 226Ra (from 214Pb) activity from that of 210Pb for each sample. The 210Pbxs specific activity profile showed an almost monotonic decrease with depth in the first 10 cm, from activity values of 35.92(8.93) to 6.59(6.23) Bq kg-1. Two dating models were applied, the CF: CS model (for details on the model see [21] and the CRS-MV model [41]. The CF: CS model was applied (considering constant sedimentation rates and negligible mixing) to the upper 10 cm of the core. In this core section, 226Ra specific activity values were nearly constant (32.79 ± 3.65 Bq kg-1), while below this section, activities were slightly lower (around 23 Bq kg-1) up to 28 cm, and then increased markedly (up to 51.57 Bq kg-1). Mean sedimentation rates were obtained by a weighted least-squares fitting procedure [42] from the 210Pbxs specific activity profile plotted on a log scale against both depth and mass depth, which resulted in a linear profile for the considered section (Figure 6a). Then, apparent sedimentation rates of 2 mm yr-1 and mass accumulation rates of 4.5 g cm-2 yr-1 were obtained. Nevertheless, when applying the CRS-MV model that keeps track for compaction, considering only a constant 210Pbxs flux to the sediment, where the sediment accumulation rates are estimated from the minimum variance of the least-squares fit of the line representing the 210Pbxs inventory (considering measuring uncertainties), average sedimentation rates of 7.6 ± 4.0 mm yr-1 and average mass accumulation rates of 2.10 ± 1.10 g cm-2 yr-1 were obtained (Figure 6b). The total 210Pbxs inventory was 9,710 ± 1,050 Bq m-2 and the corresponding 210Pbxs flux, 300 ± 30 Bq m-2 yr-1.
5. Discussion
5.1 Geochemical interpretation of the cores
The marked decrease in the TOC and TN profiles and in the sulphate pore water contents observed in the upper part of the SS10T01 core (Figure 2) suggests that the oxic zone spans the first 2.5 cm. This limit coincides with those defined by Álvarez-Iglesias and Rubio [43] because the high organic matter content in San Simón sediments makes the oxic zone to be restricted to a few upper centimeters. TOC, TN and sulphate contents continued to decrease in the suboxic zone of the studied sediments (Figure 2). The sulphide content in porewaters is very low due to the oxidation of sulphides both in the oxic and the suboxic zones (Figure 2).
Itrax data allow obtaining geochemical variations with highresolution directly from sediment cores in a few hours. Figure 3 shows the comparison of some elements profiles of the SS10T01 core obtained with the Itrax versus those got by ICP-OES and conventional XRF analyses. The Itrax profiles show basically the same features than those obtained from the ICP-OES and XRF analyses on discrete samples with a slight depth offset in some cases. Features mismatches are due to a combination of discrete sampling constraints and differences in relative resolution depths. The correlation range obtained between the Itrax profiles and conventional techniques (reaching an r=0.858; p<0.01, in the case of correlation with the Pb obtained from ICP-OES analyses) proved the reliability of the Itrax data to rapidly know the relative variations of sediment composition along the cores.
Following the relative variations in the Pb content in the two SS10 cores, Figures 3 and 5 showed some differences in spite of that both cores are replicates. However, similarities can be clearly detected in both Pb profiles. Lead maximum in the SS10T03 core (around 98,000 p.a.) matches with the Pb peak in the SS10T01 core around 85,000 p.a.) at 13 cm. Below this depth, there is a significant peak area decrease downwards in both cases, more marked in the SS10T01 core. Thickness differences between the Pb peaks in cores SS10T01 and SS10T03 resulted from the tail inhomogeneity and subsequent modification of the local sedimentation conditions at the sampling site scale.
Itrax data are also useful for searching the origin of metal pollution from relationships between different elements. A significant correlation was obtained between Pb and Zn (r=0.64, p<0.05) because Zn oxide is widely used in the ceramic industry. High contents of Zn were previously indicated for waste channel samples from the ceramic factory (up to 0.09%) [4]. Moreover, some of the ceramic pieces made in this factory were decorated with Ag-thread; therefore, Ag pollution could come from this industry too, in spite of its lower correlation with Pb (r=0.46, p>0.05). The lack of a good correlation in this case could be due to a temporary use of Ag in Pontesa. On the other hand, the best correlation was found between Pb and As (r=0.93, p<0.01), suggesting that As could be used as a glaze in the old ceramic factory, as it was proposed by Howarth et al. [13]. Furthermore, the high concentration of these elements in the uppermost 13.5 cm (Figure 3) where the TOC content is higher (Figure 2) suggests that the organic matter could be a ligand for these trace metals.
Another application of Itrax data is the study of variations in the organic matter content. This is valuable information to take into account because they can condition the adsorption of toxic metals as well as the distribution and activity of radionuclides in the sediments [44]. The incoherent and coherent scattering (inc/coh) and the Br/Cl profiles provided by the Itrax constitute a fast option to study these variations [23,45]. According to Rodríguez-Germade et al. [26], the inc/coh ratio works better when the organic matter comes from a mixture of terrestrial and marine sources, while the Br/Cl ratio is only valid when the organic matter is mostly marine. In this case, we have used the inc/coh ratio because the organic matter of the sediments of the study area results from a mixture of both sources [43].The inc/ coh profile of the SS10T03 core (Figure 5) showed a p.a. average of 2.2 ± 0.3 in the upper part with a reduction at 12 cm (1.5± 0.1) and a marked increase from 34 cm to the bottom (3.4 ± 0.4). The inc/coh minimum at 12 cm matches with the Pb maximum and both profiles are almost mirror images. This coincidence is due to the scattering behaviour because incoherent scattering is more common in lighter elements with low atomic numbers, while coherent scattering prevails in heavier elements with high atomic numbers [46]. For that reason, the extremely high Pb concentration at 12 cm (around 4.0% according to the extrapolation of the Itrax data from the SS10T01 core) results in a marked increase of the coherent scattering and a consequent inc/ coh reduction. However, Pb concentration is significantly lower at 34 cm showing a less influence on the inc/coh ratio. In this case, the inc/ coh increase indicates a higher organic matter content in the bottom of the core which affected to the radionuclides activity as it was shown in section 4.2 (Figure 5).
5.2 Chronological framework and sedimentation rates
The sedimentation rates obtained by 210Pbxs and 137Cs dating are comparable: around 7.6±4.0 mm yr-1 (for the whole core) and around 5.3 mm yr-1 (for the upper 25 cm) respectively; and similar to those indicated in previous studies (5.5-6.0 mm yr-1, [8-9]). If the 137Cs specific activity profile of SS10T03 core is compared (Figure 7a) to those of the cores previously studied (SSMPA and C2, collected in 2003 and 1999 respectively) in the same area of San Simón Bay [8-9], the profiles are very similar. In the SSMPA core it is observed an upwards increase of the activity in the first 20 cm, with a slight diminution of this trend between 6 and 2 cm. Something similar is also observed in the first 16 cm of the C2 core, with that slight diminution detected in the surficial samples; while this is observed between 11 and 6 cm for the SS10T03 core. Then, it is detected a displacement of this interval of about 4-5 cm (considering comparison to SSMPA core) or 9 cm (considering C2 core), indicating sedimentation rates of 5.7-7.1 mm yr-1 or 8.2 mm yr-1, respectively, for the most recent sediments (rates very similar to those obtained by the CRS-MV method considering only the upper 13 cm: 7.2±2.5 mm yr-1).
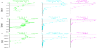
Another option to estimate sedimentation rates is to consider the Pb inputs to the Bay as a time marker by comparison of Pb depthprofiles for cores collected at different times. In this case, the proved reliability of Itrax data and the similarities observed in the Pb profiles of the SS10 cores (section 5.1) allowed the use of the SS10T03 Pb profile (Itrax data) for these estimations. Figure 7b showed a marked displacement of the Pb subsurficial maximum of about 6 or 7 cm when comparing Pb profiles for the cores SS10T03, SSMPA and C2, obtaining sedimentation rates of 5.5 mm yr-1 and 6.4 mm yr-1. This is in concordance with the temporal framework obtained by the application of the CRS-MV method in the SS10T03 core. Then, the sedimentary record of this core would span about 60 years.
In spite of these sedimentation rates variations, the Pb profile of the SSMPA core shows clearly the beginning of the Pontesa ceramic factory activity around 1972 with Pb contents close to or similar to background levels before this year (depths higher than 25 cm). This industrial activity resulted in a significant Pb increase from 18 cm depth (in core SS10T03) towards the surface reaching a maximum waste discharge at the beginning of the 1990s. Since then, Pb contents decreases upwards and, despite the Pontesa factory closure in 2001, very high Pb concentrations still remain in 2010.
5.3 Lead geochemistry and inputs
Pollution levels in San Simón Bay were previously calculated in former studies [4,7] because this zone is vulnerable to pollutants accumulation due to the physiography and hydrodynamics of this sedimentary environment. Moreover, a special attention has been dully paid to the effects of the old ceramic factory, identified as the main source of Pb [4,10-11] and subsequently, the highest pollution problem in this area. Total Pb contents in the SS10T01 core were extremely high (1.72-6.67%). The whole core is polluted with Enrichment Factors [47] between 560 and 1,250 (where EF = ([Pb]/ [Al]/( [Pb]BL/ [Al]BL), being BL= background level and considering established BL for the study area of 54 μg g-1 for Pb and 9.91% for Al for granitic sources [43]).
About 18% of Pb appeared in the bioavailable fraction, whereas more than a half was detected in the recoverable fraction. This means that high quantities of Pb are adsorbed onto sedimentary particles, forming insoluble salts and organic complexes, which are environmentally available. In comparison to other cores collected in the same area in 1999 [6,48] the percentages of Pb in the recoverable and the residual fractions are similar but in the opposite way (56% residual and 44% recoverable). This small difference could be due to a higher proximity to the ceramic factory of the SS10T01 core, since samples collected in the waste channel of the factory in 1999 [4] also showed higher percentages of Pb in the recoverable fraction. Moreover Pb stable isotope ratios showed values lower than those typical of natural sediments of the study area [10] and close to those characteristics of the ceramic factory samples [10], (see also Table 2). The observed isotopic ratios are similar to those of the upper centimetres of the core SSPMA, an interval affected by the ceramic waste inputs after the establishment of the ceramic factory, which started at the beginning of the 1970s [10].
When calculating the correlations among the different isotopic ratios for each fraction it is observed high relationships (r2 between 0.8463 and 0.9991). This is consequence of a mixture of natural and anthropogenic Pb sources to the sediments. In order to determine the total anthropogenic component (TAC) of the different Pb stable isotope ratios, the mixture model proposed by Ferrand et al. [35] was applied. Results obtained for the different sediment fractions are shown in Table 2. It is observed that the isotopic ratios are close to the characteristic ratios of gypsum from the ceramic factory, confirming, as previously indicated [10], that the main Pb source to the Bay in recent years has been the ceramic factory. Furthermore, in the case of the studied sediments, the anthropogenic Pb inputs (Pbanthr) calculated by subtraction of the natural Pb input for each sample (estimated considering Al concentrations as a grain-size proxy, that is, based on Pb/Al ratios) indicate that the Pbanthr represents 99.8-99.9% of total Pb in the samples. Then, in this case, when applying a binary mixing model [35-36] to estimate the anthropogenic lead isotope ratios for each depth they are almost the same as the total sample isotopic ratios (Table 2). Furthermore, they are very close to those anthropogenic lead ratios estimated for the upper centimetres of the SSMPA core (Table 3;[10]).
The application of a three source model [37-38] to the isotopic ratios determined for the total fraction to apportion the different Pb anthropogenic sources, considering the isotopic signatures of the different sources (ceramic factory, petrol and coal) selected by Álvarez- Iglesias et al. [10] after a literature revision on isotopic signatures of Spain and another western European countries (Table 3), confirmed the ceramic factory as the main Pb anthropogenic input to the Bay (96±6% of the Pb inputs), whereas the contribution of petrol-related inputs was very small (4±6%), and that of coal-related inputs, null or almost negligible.
6. Conclusion
Even though San Simón Bay is a coastal system with anthropogenic Pb inputs, 210Pb and 137Cs dating, together with a detailed geochemical study (including high-resolution Itrax data) allowed establishing sedimentation rates and determining the historical trend of metal inputs in the sediments. Moreover, sedimentations rates estimated from Itrax profiles matched with those estimated from 210Pb and 137Cs dating.
Itrax data are very useful to minimise grain size effects (normalizing with Fe or Ti profiles) and to follow the relative variations of sediments composition (e.g., inc/coh as indicative of organic matter content) that could affect radionuclides activities or metals distribution. Moreover, considering pollutant inputs as time markers, Itrax Pb profiles are valid to calculate sedimentation rates and to monitor spatial and temporal Pb pollution.
The application of several models on Pb stable isotopes confirmed that the ceramic factory is the main source of anthropogenic Pb in San Simón Bay even after its closure around 2001. In fact, extremely high Pb concentrations in sediments remain in 2010. More than half of this Pb was detected in the recoverable fraction and it could be released to the water column due to redox changes. Moreover, a 18% of the total Pb is in the bioavailable fraction, resulting in an alarming pollution problem taking into account the high Pb concentrations. These considerations suggest the need of environmental projects to recover these kind of fragile ecosystems, where XRF core scanners could represent powerful, quick and reliable tools for environmental coastal management.
Competing Interests
The authors declare that they have no competing interests.
Acknowledgments
This work was supported by the Spanish Ministry of Science and Innovation through projects IPT-310000-2010-17 (INNODRAVAL) and GCL2010-16688 and by the Xunta de Galicia through project 10MMA312022PR. I. Rodríguez-Germade was funded by a FPU scholarship from the Spanish Ministry of Education .P.A.-I. thanks the support from the Xunta de Galicia (Spain) through a postdoctoral contract and a short stay fellowship under the Ángeles Alvariño programme.