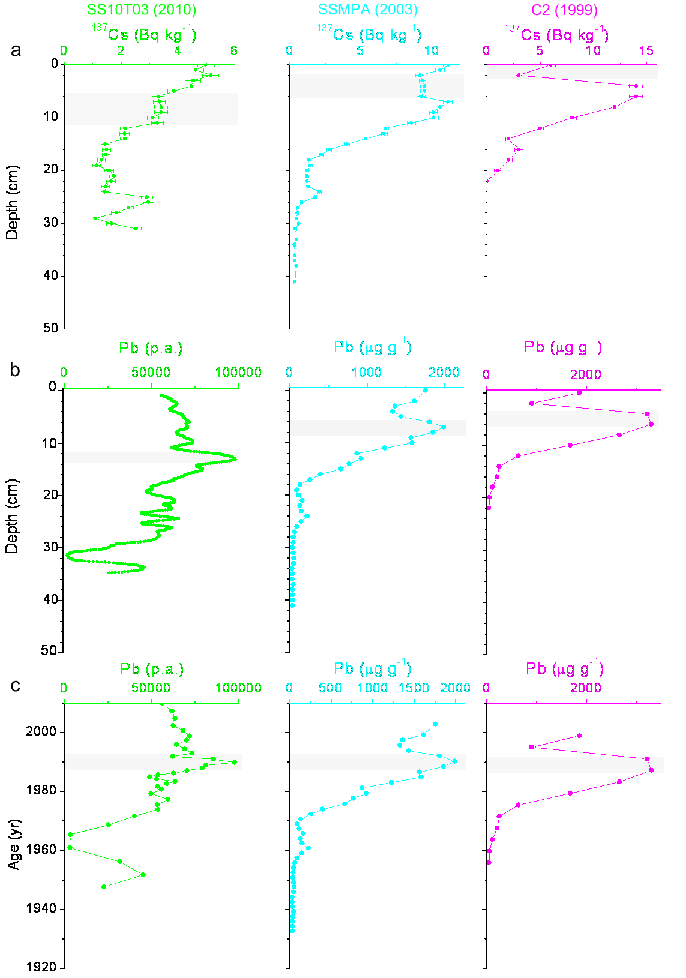
Figure 7: Comparison of a) the depth-wise specific activity profiles for 137Cs; b) the total Pb contents; and c) the chronological profiles of total Pb content in SS10T03 core (collected in 2010), SSMPA core (collected in 2003) and C2 core (collected in 1999). Grey bars are shown as marker levels. SSMPA and C2 cores data were taken from previous studies [8,9].