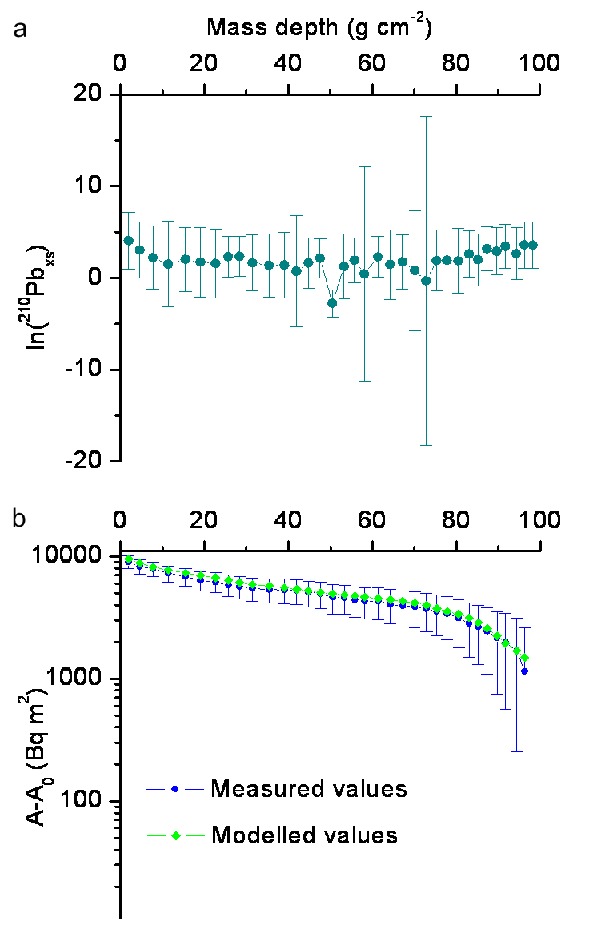
Figure 6: a) Mass depth profile of 210Pbxs specific activity plotted on a log scale; b) Mass depth profiles of 210Pbxs inventory. Blue dots correspond to measured values and green diamonds to the modelled values according to the CRS-MV model.