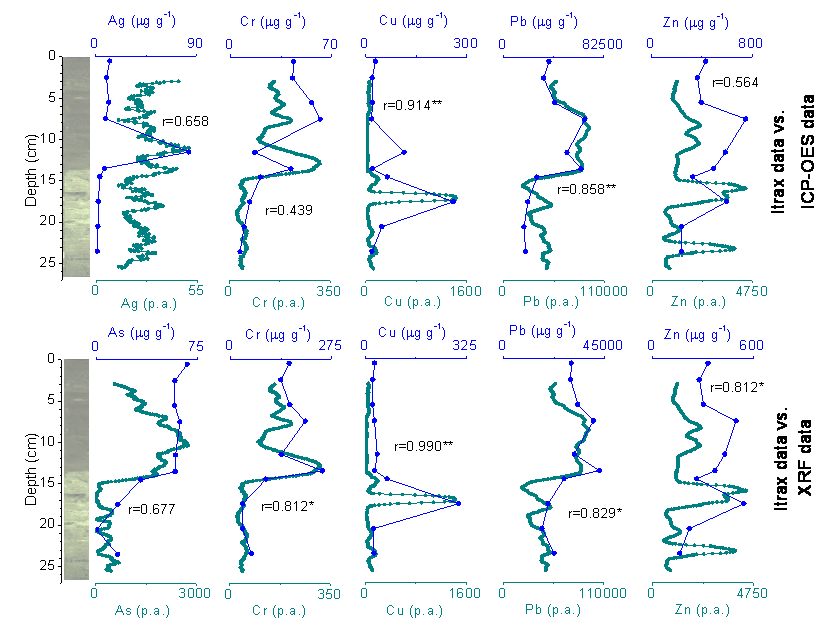
Figure 3: Comparison of the geochemical profiles of some elements obtained with Itrax, ICP-OES and conventional XRF analyses for SS10T01 core. Itrax data were smoothed using a 20 point-running mean (every 1 cm) according to Rodríguez-Germade et al. [49] and they are expressed as peak areas (p.a.). Pearson correlation coefficient (r) shows the correlation between both profiles (*: p<0.05; ** p<0.01).