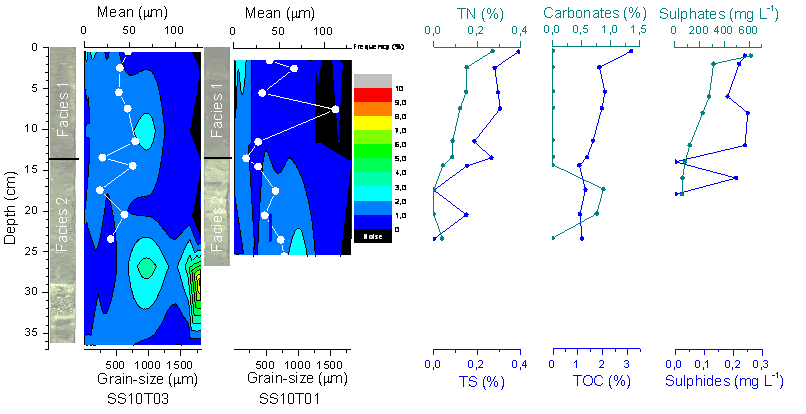
Figure 2: Optical images obtained with the ItraxTM Core Scanner, and particle size distribution plots of the SS10T03 and SS10T01cores followed by total nitrogen (TN), total sulphur (TS), total organic carbon (TOC) and carbonates profiles together with sulphate and sulphide contents in pore waters of the S10T01 core.