


1. Introduction
The principal definition of free sugars was designed to split carbohydrates into elements that are directly related to the impact on health rather than a chemical definition, and followed studies related to chronic diseases caused by overweight and obesity as well as dental decay. This free sugars detention led WHO and FAO to design revised food pyramids that is not only based on nutrition but also based on scientific data suggesting the consumption of free sugars within the food pyramid to not exceed 10% of the total energy intake. This suggestion is to halt the rise of diabetes and obesity and to reduce the burden of premature death due to non-communicable diseases (NDCs).
Free sugars, are manufactured sugars in the form of pure crystals, powders, or syrups such as monosaccharides of glucose and fructose or disaccharides such as sucrose and maltose, plus, sugars present in honey, fruit juice, fruit juice concentrate, molasses, golden syrup, agave syrup, rice malt syrup, coconut blossom syrup, coconut syrup, maple syrup, high maltose syrup (HMS) and high fructose corn syrup (HFCS) that are added to foods, baked goods, or beverages.
2. Carbohydrates Metabolic Pathway
2.1 Free monosaccharide sugars
Monosaccharides are simple carbohydrates that are classifieds into aldehydes such as glucose and ketos such as fructose. Both are simple sugars that does not require digestion and can be absorbed directly into blood stream.
2.1.1 Glucose
Also known by the name dextrose C6H12O6 commonly manufactured by enzymatic hydrolysis of starch containing crops such as corn, rice, potato, etc. North America is the largest consumer of granulated glucose, and corn syrups (glucose syrup) followed by Europe and Asia Pacific.
Carbohydrates metabolism are mainly glucose metabolism that regulated by three hormones of Insulin [1] Glucagon [1] and Epinephrine [2]. Insulin is responsible to stimulate cells uptake process of glucose, and both Glucagon and Epinephrine are inhibitors for glucose consuming process.
There are three steps of the metabolism (catabolism) of glucose. These steps are glycolysis [3], Krebs cycle [4] and electron transport chain [5,6]. The free energy released from these three steps are ~32ATP (adenosine triphosphate) per glucose unit.
2.1.1.1 Glycolysis
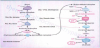
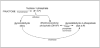
Glycolysis occurs in the cell cytosol under aerobic respiration It is nine enzymatic steps of metabolic pathway that converts the six carbon glucose into two three carbon pyruvates by a series enzymatic process (figure1) generating intermediate metabolites and producing 2 ATP and 2 NADH (Nicotinamide adenine dinucleotide).
2.1.1.2 Krebs cycle
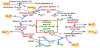
Krebs cycle which also know by name citric acid cycle or TCA cycle is a part of cellular respiration that occurs in the cell mitochondrial matrix. Pyruvate that was generated from glycolysis is transported into the mitochondria and loses carbon dioxide (CO2) to form the two carbons acetyl-CoA. When acetyl-CoA is oxidized to carbon dioxide in the Krebs cycle which is eight enzymatic steps metabolic pathway, chemical energy is released and captured in the form of 2 GTP (equal 2 ATP), 6 NADH, and 2 FADH2, per two pyruvates that was generated from one glucose unit in glycolysis pathway. In summary, once the acetyl-CoA is produced it inter into the Krebs cycle (figure 2) that started by the Coenzyme-A (CoA), adding an acetyl group that contains two carbons to the oxaloacetate that contains four carbons leading into the formation of the six carbons citric acid. Once citric acidis formed, it goes through a series of enzymatic steps releasing, two molecules of carbon dioxide (CO2) and reinforced the formation of oxaloacetate to continue in the next Krebs cycles pathway.
2.1.1.3 Electron transport chains (ETC)
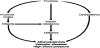
The net energy generated from both glycolysis and Krebs cycle are 4 ATP (including 2 ATP from glycolysis), 8 NADH (including 2 NADH from glycolysis) and 2 FADH2(from Krebs cycle). Electron transport chain is a process that convert the energy stored in the 8 NADH into 24 ATP and the energy stored in the 2 FADH2 into 4 ATP via the phosphorylation of ADP into ATP (one NADH converted into energy stored in three ATP and one FADH2 is converted into energy stored in two ATP).
The mechanism by which ATP is formed in ETC is a serious of complexes process that transfer electrons from electron donors to electron acceptor and occurred in the inner cytoplasm membrane of mitochondria. In summary, there are electron carrier’s enzymes that are embedded in the inner mitochondrial membrane creating an electric proton (H+) gradients that drive the synthesis of ATP via the protein enzyme ATP synthase [7] that is also embedded in the inner mitochondrial membrane (figure 3).
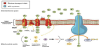
These electron carrier enzymes are:
- Complex (I): NADH-ubiquinone oxidoreductase [EC.1.6.5.3]
- Complex (II): Succinate ubiquinone oxidoreductase. [EC.1.3.5.1]
- Complex (III): Ubiquinol cytochrome c oxidioreductase [EC.1.10.2.2]
- Complex (IV): Cytochrome c oxidase.[EC.1.9.3.1]
The final electron acceptor in ETC is oxygen. The oxygen together with electrons and protons form molecules of water (2H + 2e + 1/2 O2→H2O + energy).
2.1.2 Fructose
Also known by the name laevulose C6H12O6 commonly manufactured enzymatically from corn (glucose) syrup by the enzyme glucose isomerase in the form of high purity granulated fructose [8] or in the form of high fructose corn syrup (HFCS) [9]. High fructose corn syrup is a mixture of about 42 percent fructose and 53 percent glucose. This syrup is called HFCS 42, and is about as sweet as natural disaccharide sugar (sucrose) and it is commonly used in foods and bakery products. The HFCS 55, which contains approximately 55 percent fructose and 42 percent glucose, is sweeter than sucrose and is mostly used in soft drinks as a sweetener [10]. HFCS is often replaced the granulated sucrose, because of its manufacturing advantages over sucrose. It is easier to manufacture and more cost-effective comparing to sucrose. HFCS is a ubiquitous sweetener in United States because it’s advantages over sucrose and cheaper. The United States Food and Drug Administration (FDA) has determined that HFCS is a safe ingredient for foods and beverages manufacturing. However, there is debate over whether HFCS presents greater health risks than other sweeteners due to its higher consumer’s daily consumption (intake) in foods and beverages. Scientific data demonstrated that excessive consumption (intake) of fructose or HFCS in foods or beverages may contribute to insulin resistance [11] obesity [12] elevated blood LDL cholesterol, and high triglycerides level [13] in blood leading to metabolic syndrome, Type 2 diabetes, and cardiovascular deceases.
Unlike glucose which is metabolized in the body cells, fructose is metabolized in the liver where it is directed toward replenishment of liver glycogen and triglyceride synthesis [14] (figure 4).
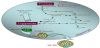
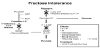
The initial metabolism (catabolism) of fructose which is refer to fructolysis is in analog with glycolysis of glucose using many of the same enzymes and generating the same intermediate metabolites, In summary, fructolysis [15] which occurred completely in the liver utilize the enzyme fructokinase to produce the six carbons fructose-1 phosphate which is split by the enzyme aldolase B into three carbons of triose dihydroxyacetone phosphate (DHAP) and glyceraldehyde. Unlike glycolysis a third enzyme triokinase is required to phosphorylate glyceraldehyde into glyceraldehyde-3-phosphate. Resulted in two triose phosphates (dihydroxyacetone phosphate and glyceraldehyde-3-phosphate) that are identical to the two triose phosphates in glucose glycolysis in the glycolytic pathway to pyruvate (figure 5).
2.1.3 Fructose metabolism and health
Fructose is only metabolize in the liver and it cannot be used for energy by body’s cells therefore it is not only completely useless for the body but it is toxin at a higher intake as free sugars in foods or drinks. The liver function is to remove this toxin (fructose-1-phosphate) and, convert fructose into fat stored in body cells causing obesity. In addition, higher consumption of fructose could damage the liver or could leads into insulin resistance as well as fatty liver diseases. Scientific data showed that fructose has the same effects on the liver as alcohol beverages which is already known as a liver toxin.
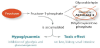
Abnormalities in fructose metabolism [16] that is due to heredity lacking one of the two important enzymes fructokinase or aldolase B in fructose metabolism( fructolysis) could lead to fructose intolerance (figure 6) symptoms. Fructokinase enzyme deficiency could lead into the inability to phosphorylate fructose into fructoae-1-phosphate in liver causing high fructose level in cells that will increase fructose in blood exceeding the renal threshold of fructose reabsorption resulting in the appearance of fructose in the urine causing a benign symptom of essential fructose urea. This is a not constant symptom but depends largely on fructose consumption in the diet. The sever symptom is aldolase B enzyme deficiency that could lead into in the accumulation of fructose 1 phosphate in hepatocytes, kidney and small intestines. Resulting the inhibition of glycogenolysis (breakdown of glycogen) into glucose and gluconeogenesis (conversion of pyruvate, lactate, glycerol, alanine, and glutamine) into glucose (figure 7), causing severe hypoglycemia, a symptom with abdominal pain, vomiting, hemorrhage, jaundice, hepatomegaly, and hyperuricemia that is eventually lead to liver and/or renal failure and death. Fructose intolerance incidence are heredity disease that varies throughout the world, but it is estimated in the range between 1:12,000 to1: 58,000.
2.1.4 Major risk factors from high daily intake of fructose or high fructose sweetener [17]
- Fructose increases uric acid production causing gout, kidney stones, and precipitate or aggravate hypertension [18].
- Excess fructose can create gut flora imbalances and promoting the growth of pathogenic bacteria.
- Damage liver result in chronic excess of fructose in blood causing dyslipidemia (blood lipid markers) a symptom that indicate a risk for heart disease [19] (figure 8.)
- Causing leptin resistance [20], a hormone that controls appetites and metabolism to maintain a normal weight. Leptin resistant patient tend to gain fat and become obese.
- Effect brain function related to appetite regulation (animal studies shown to impair memory) [21].
- Causing all the problem associated with the metabolic syndrome [22] such as diabetes, obesity and heart disease.
- Cancer cells proliferate faster in the presence of fructose [23] as their source of energy.
- Fructose reacts with protein and polyunsaturated fatty acids in the body at higher rate than glucose, creating advanced glycation end products (AGEs) compounds that create oxidative damage to cells in the body leading into inflammation and host chronic diseases such Cardiovascular, Diabetes, and Alzheimer’s [24].
- Causing Insulin resistance leading to fatty liver disease [25].
- The hereditary disease of fructose intolerance causing sever hypoglycemia, abdominal pain, vomiting, hemorrhage, jaundice, and hyperuricemia eventually leading to renal failure and dearth [26] from excessive fructose or HFCS intake in foods or sweetened beverages.
2.2 Free disaccharide sugars
Disaccharide is two monosaccharides combined into one and results when two monosaccharides are joined together by a glycosidic bond in a chemical process called dehydration synthesis. These disaccharides must be enzymatically digested into monosaccharides prior to absorption into blood stream.
2.2.1 Sucrose
Also known by the name laevulose or table sugar C12H22O11, it is disaccharide sugar composed of the two monosaccharides, glucose and fructose. Linked together via glycosidic bond formed between C1 on the glycosyl subunit and C2 on the fructosyl subunit. Sucrose is produced commercially from sugarcane or sugar beet. It is used extensively similar to high fructose corn syrup (HFCS) as a sweetener in foods, baked goods, and beverages. Sucrose is digested by the enzyme sucrase (sucrose alpha-glucosidase) located in the membrane of the microvilli lining into glucose and fructose molecules. Both two monosaccharides are absorbed into the blood stream and metabolized via fructolysis as shown in (figure 5) and glycolysis (figure1) respectively. Overconsumption of sucrose has been linked with adverse health effects which can contribute to increase the risk for chronic disease similar to the risk that was highlighted from overconsumption of fructose or HFCS.
2.2.2 Maltose
Also known by the name maltobiose or malt sugar C12H22O11, it is a disaccharide composed of two glucose molecules linked together via glycosidic bond formed between C1 on the first glycosyl subunit and the C4 of the second glycosyl subunit. Maltose is produced commercially from starch hydrolysis using the enzyme ß-amylase (4-alpha-d-glucan maltohydrolase) removing two glucose units at a time and producing maltose.
Maltose is digested by various maltase enzymes secreted by the intestine, into two glucose molecules which absorbed into blood stream and further processed: either via glycolysis pathway (figure1 ) to provide energy, or stored in the form of glycogen.
Maltose is not important sugar and is not really useful as a sweetener, even though it has long been used in hard candy and frozen desserts because of its unique tolerance to heat and cold. It can be hidden in a lot of foods that do not taste particularly sweet, like bagels. It is very high glycemic so it is not suitable for diabetics and causing tooth decay especially for children who are the major customers for candies and frozen desserts.
The main sugar in high-maltose corn syrup (HMCS) is maltose and it is present in foods, candies and cereals. HMCS is different from high-fructose corn syrup (HFCS), which is found in a wide variety of foods. The difference between the two is that the main sugars in HFCS are fructose and glucose, while the main sugar in HMCS is only glucose. Because of their differences in sugars, HMCS may not carry the same risks as HFCS, but it's still a free (added) sugar, and its high intake should be limited.
3. World Health Organization (WHO)
It is agency in the United Nation (UN) Development Group concerned with international public health. It was established in 1948 with headquartered in Geneva, Switzerland. Since its creation, it has played a leading role through reporting, publications, and networking in the eradication of smallpox, and its current priorities include communicable (CDs) and non-communicable diseases (NCDs), ageing, occupational health, substance abuse, food safety, nutrition, and healthy eating.
WHO roles in public health [27] are
- Providing leadership on matters critical to health and engaging in partnerships where joint action is needed.
- Shaping the research agenda and stimulating the generation, translation and dissemination of valuable knowledge.
- Setting standards, promoting and monitoring their implementation.
- Articulating ethical and evidence-based policy options.
- Providing technical support, catalyzing change, and building sustainable institutional capacity.
- Monitoring the health situation and assessing health trends.
4. WHO Guidelines on Free Sugars Intakes for Adults and Childeren
Ongoing efforts of World Health Organization (WHOs) are to address the issue of non-communicable diseases (NCDs) as the leading causes of death worldwide. The four main types of NCDs are cardiovascular diseases that are link to heart attacks or stroke, chronic respiratory diseases such asthma, diabetes and cancers.
Poor diet and physical inactivity are considered to be the most important risk factors in NCDs, and there is concern that increasing intake of free sugars in the form of sweetened foods, baked goods, and beverages may lead to weight gain and increase the risk of NCDs for both adults and children [28]. Plus, the over consumption of free sugars is associated with poor dietary because it reduce the intake of healthy diets.
WHO objectives are to provide evidence suggesting an association between the reductions of free sugars intake and reducing body weight will lead to reduce the potential risk of NCDs for both adult and children [29]. Develop measures as guidelines to decrease the consumption (intake) of free sugars for both adult and children, and to implement the developed guidelines through a range of public health intervention [30].
Their strategies in achieving the above objectives are
- Identification of priority questions and outcomes.
- Retrieval of the evidence.
- Assessment and synthesis of the evidence.
- Formulation of recommendations.
- Planning for dissemination, implementation, and evaluation.
- Future updating the developed guidelines.
Grading of Recommendation, Assessment, Development and Evaluation (GRADE) methodology [31] was used to assess the quality of evidence identified through resent systematic reviews of the scientific literatures on preselected topics related to free sugars intake. An International multidisciplinary group of experts with the participation of WHO Nutrition Guidance Experts Advisory Group (NUGAG) reviewed and discussed the identified evidence developed by GRADE, drafted confirmed evidences and reached consensus on the strength of the drafted evidences. External experts and stakeholder panel were also involved through the above process.
The drafted evidences based on Meta-analysis [32] randomized control trials (RCTs) suggested the following
- Adults who reduce their free sugars intake have lower body weight.
- An increase in the amount of free sugars intake in any diet is associated with weight gain.
- Children with a high intake of sugar-sweetened beverages, backed goods, or foods are more likely to be overweight.
- There is a higher incidence of dental caries in people with free sugar intake exceeding 10% of total energy.
- Higher rates of dental caries in children observed when the level of free sugars intake is over than 10% compared to less than10 % of total energy source.
- Further studies, reviled that lower level of dental caries development where observed when free sugars intake was less than 5% of total energy source.
Based on the above identified evidences developed by GRADE methodology and reviewed by NUGAG, the World Health Organization (WHO) generated the following recommendations as guidelines on free sugars intake for both adults and children [33]:
- Reducing free sugars intake throughout the person life span.
- Reducing free sugars intake for both adult and children to less than 10% of total energy source (18.2 kg / person / year or 50 gm / person / day).
- Suggesting as a conditional recommendation for further reduction the free sugars intake to less than 5%of total energy source (10 kg / person / year or 27gm / person / day].
In addition the following remark was added to WHO free sugars guidelines
- Free sugars intake guideline does not apply to individuals in need of therapeutic diets or under the management of malnutrition.
- Countries with low level of free sugars intake their level should not change.
- No evidence of harm in reducing free sugars intake to less than 5% of total energy source.
- Dental caries still progresses in population exposed to fluoride [34].
- Free sugars intake guidelines should be used in conjunction with other nutrients guidelines and dietary goals, in particular those related to fats and fatty acids including saturated and trans-fatty acids.
- Free sugars intake guidelines should be used worldwide to guide public health, nutrition policies and programs to promote a healthy diet.
Guideline Review Group of WHO will continue periodically updates the free sugars intake guidelines to reflect the latest scientific data and medical knowledge for the prevention of NCDs. The next review for updating free sugars intake guidelines is planned for the year 2020. If a new scientific data and information are available at that time the Guideline Review Group of WHO will evaluate the new evidence and revise the existingfree sugars intake guidelines.
Worldwide policy-makers and programmer managers are responsible to implement the WHO guidelines on free sugars intake to assess current intake levels of free sugars intake in their countries population relative to the standard intake level set by WHO, and to reduce free sugars intake, where necessary, through public health interventions via consumer education, food labelling, regulation of marketing foods, baked goods, and beverages that are high in free sugars, and developing a strategy to reformulate manufactured food products that are high in free sugars content.
In addition, implementation, monitoring the adoption and adaptation of WHO guidelines on free sugars intake is the key element for WHO’s to achieve their objectives and it is the responsibility of WHO Global database on the Implementation of Nutrition Action (GINA). GINA worldwide responsibilities are to assess in monitoring and implementing WHO guidelines on free sugars intake cross countries.
GINA was launched by WHO in the year 2012 and is currently providing valuable information on the implementation of numerous nutrition policies and interventions plus sharing their world information and monitoring data with the WHO centralized platform of Nutrition Health and Development (NHD).
5. Discussion
Much of free sugars consumed today are hidden in processed foods that are not usually seen as sweets. For example, a tablespoon of ketchup contains around 4 grams of free sugars, and a can of sweetened beverages contains over 40 grams of free sugars.
Studies have indicated potential links between free sugars intake, and health hazards, including tooth decay, diabetes, obesity, and premature death due to non-communicable diseases (NDCs). NCDs are accounting for over 36 million deaths per year of the world population [35] and are defined by the WHO as chronic diseases which are not passed from person to person.
Tooth decay (dental caries) has become a prominent health hazard associated with the free sugars intake, in foods, deserts, candies and sweetened beverages. Oral bacteria such as Streptococcus mutans [36] in dental plaque metabolize sugars into lactic acid, lowing the pH of the tooth's surface, and stripping it of minerals in the process known by the name tooth decay.
Diabetes mellitus [37] causes the body poorly metabolize sugar, and occurs when either: the body attacks the cells producing the hormone insulin that metabolize sugars resulting in body’s cell starve for energy (Type 1 Diabetes) or the body’s cells exhibit impaired responses to insulin causing glucose builds up in the blood stream, increasing blood acidity and damage body’s vital organs in a long run (Type 2 diabetes).
Overweight and Obesity have increased worldwide during the past 30 years implicating health care cost and causing an estimated 3.4 million death per year worldwide [38]. The National Health and Nutrition Survey of United Nations confirmed that over consumption of carbohydrates especially free sugars as a source of energy in United States have increased the level of overweight and obesity population into 37%. In general [39], if this trend will continue worldwide, it is estimated that by the year 2030 about 2.16 billion individuals will be classified as overweight and about 1.12 billion [40] will be classified as obese resulted in increasing the rate of NCDs and healthcare cost.
Knowing the argent to change the rate of overweight and obesity globally the Study Group of World Health Organization (WHO) took the necessary action in the year 1989 to internationally reduce overweight, obesity and NCDs epidemics by developing for the first time a health policy and recommendations as guidelines for reducing free sugars intake to less than 10% of total daily energy source and in the year 2002 a joint WHO/FAO expert consultation [41] updated the 1989 guidelines on free sugars intake for a further reduction to less than 5% of total energy source (if possible). In the year 2014 WHO drafted new guidelines on free sugars intake and opened public consultation [42] seeking inputs from stakeholders. Expert per review committee of WHO received more than 170 comments from representatives of government agencies, non-governments organizations, United Nation agencies, industries and academic institutions as well as other interested individuals on free sugars intake. Based on comments received the new updated free sugars intake guidelines is expected to finalize in the year 2020.
WHO's efforts is to achieve their global target set action plan to halt the rise in diabetes and obesity and reduce the burden of premature death due to NCDs to 25% by the year 2025 [43], plus ending childhood obesity by raising awareness and build momentum for action addressing childhood obesity and free sugars intake.
For WHO to achieve their target set plan globally the free sugar intake guidelines should be used in conjunction with other nutrient and dietary guidelines to guide the development of effective public health nutrition policies and programs for promoting a healthy diet , in particular those guidelines that are related to fats and fatty acids including saturated and trans-fatty acids.
Countries are responsible to assist WHO in achieving their target set for the year 2025 by translate WHO free sugars intake guidelines into their food based dietary guidelines and implement health interventions locally via consumer education, dialogue with food manufactures to reduce free sugars in their processed foods, regulate marketing foods, baked goods, and sweetened beverages that are high in free sugars to children and enforce nutrition labels of food products containing free sugars including the high fructose corn syrup (HFCS) that is specially particularly prevalent in known processed foods and hiding in others.
6. Conclusion
WHO study group in 1984 recommended the daily consumption (intake) of free sugars should be less than 10% of total daily energy source to reduce the risk of overweight, obesity and tooth decay. This 1984 WHO guideline was further elaborated in 2002 by a joint WHO/ FAO (Food and Agriculture Organization) expert consultation. The new updated WHO guideline is calling for further reduction (if possible) the consumption of these free sugars to less than 5% of total energy source to halt the rise of diabetes, obesity and to reduce the burden of premature death due to non-communicable diseases (NDCs) Updated WHO free sugars intake guidelines is expected to finalize in the year 2020.
WHO‘s efforts is to achieve their global target set action plan to halt the rise in diabetes and obesity and reduce the burden of premature death due to NCDs to 25% by the year 2025 [43], plus ending childhood obesity by raising awareness and build momentum for action addressing childhood obesity and free sugars intake.
Competing Interests
The author declare that there is no competing interests regarding the publication of this article.