


1. Introduction
Non-communicable diseases, such as cardiovascular disease and obesity, are a major burden on health [4]. Their prevalence rates follow a socio-economic gradient, with those in the lowest education and income levels and living in the most deprived areas, having the highest rates [5]. Inequitable access to healthy foods is one way by which socioeconomic factors influence the diet and health of a population [5].
In Ireland, an estimated 25% of the population’s households are living in basic deprivation i.e. cannot afford two out of 11 basic household items [1]. Food poverty, defined as the inability to have an adequate and nutritious diet due to issues of affordability or accessibility [6], is a reality for many living in poverty. It is a complex issue with many health and social dimensions and an estimated 11.5% of Irish households were experiencing food poverty in 2016 [1].
In the backdrop of the global economic crises, there was a fall in average income in Ireland between 2008 and 2014 accompanied by a rise in the risk of poverty [7]. In Ireland there has been an increase in the number of people reporting that they do not have enough money to buy food [8]. The Organisation for Economic Co-operation and Development reported the number of Irish people stating that they cannot afford food doubled from 4.2% in 2008 to 9% in 2014 [8].It is well recognised that as income drops so does the absolute amount of money spent on food, whereas the proportion of income spent on food increases [6,9].
The cost of a healthy diet has been one of the major barriers identified to healthy eating. In a recent systematic review, Darmon & Drewnowski [10] investigated the role of food prices and costs on socioeconomic disparities in diet quality and health. They demonstrated that healthier diets and the majority of nutrient-dense foods have been found internationally to be more expensive. Higher consumption of fruits, vegetables, meat and fish, which are promoted as part of healthy eating guidelines, are associated with higher costs. Some nutrient-dense foods are low cost but are often unacceptable culturally, for example, lentils are a relatively inexpensive source of protein but not a staple food in Irish culture. Qualitative research finds that food is a flexible part of the household budget [11,12]. Other household costs are fixed, for example rent, whereas food costs can be reduced in low income families by choosing less nutrient-dense foods where the focus is on filling up household members.
One of the main approaches to investigating food costs and diet quality has combined food composition databases and dietary intake data with food price data [10]. The strength of this approach is that large datasets of individual’s actual intake are available for investigating, and modelling can be applied to differentiate healthier from less healthy dietary patterns for costing purposes. However, a limitation of such an approach is that an assumption is made that healthier dietary patterns and nutritious foods are culturally acceptable across the broader population studied.
Within the European Union (EU) a number of countries have developed Minimum Income Standards (MIS) to assess the adequacy of state benefits [13]. In Ireland the Vincentian Partnership for Social Justice (VPSJ) has been developing budgets for a Minimum Essential Standard of Living (MESL) since 2006, expanding the range of data to cover 90% of households across Ireland in both urban and rural areas [2,3,14].
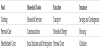
The MESL budget includes 16 categories of household expenditure including food expenditure (Table 1). The strength of the approach is that it is consumer led, engaging with people from a range of social classes to establish a social consensus on what is needed for a minimum living standard, and as a result is realistic and acceptable to the general public. It is updated on an annual basis to account for changes in costs. For most household types studied in this research the food basket is the biggest expenditure item after rent and childcare [2,3].
To inform policy and practice in the area of food poverty in Ireland quantitative data on the cost of food and specific food items is needed. The aim of this research was to use this Irish MESL data for six household types to establish the cost of a nutritious and realistic food basket as a proportion of take-home income from 2014 to 2016; to provide a detailed breakdown of the costs of different food items within the food basket, and to determine the food costs specifically for different aged children.
2. Materials and Methods
2.1 Target households
Six households were studied in this research
- two parents and two children, one child in pre-school (age 3) and one in primary school (age 10)
- two parents and two children, one child in primary school (age 10) and one in secondaryschool (age 15)
- one parent and two children, one child in pre-school (age 3) and one in primary school(age 10)
- single adult male of working age, living alone
- pensioner couple
- female pensioner, living alone.
2.2 Overview of how data used in current research was collected
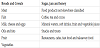
The approach used to develop budgets for a MESL in Ireland was based on a focus-group-led approach called Consensual Budget Standards (CBS) methodology [15,16]. The methodology is described in detail elsewhere [2,17]. In brief, focus groups were held for each household type. Each group consisted of between eight and 12 people from a mixture of social and economic backgrounds, and representative of the household under consideration. In order to ensure the reliability and validity of the research, three different focus groups were conducted for each household type. In total 18 focus groups involving n=161 participants were held in the Dublin area to represent urban households between 2004-2006 [2]. In 2009, nine focus groups involving 108 people were held in three rural villages in three different regions of Ireland to represent rural household types [17]. Each group met on several occasions, and through an iterative process, the groups arrived at a negotiated consensus about the goods and services the household they were representing required to have a socially acceptable MESL (Table 1). Where necessary, experts were consulted e.g. in the case of the development of 7-day food menus, nutritionists checked that the menus generated by the focus groups met nutrient requirements for household members. Any suggested changes from the nutritional analysis were brought back to the groups for agreement on acceptability. A modest amount of money was identified by each household types for social eating i.e. eating out of home and for visitors, as a minimum requirement.
During the group sessions, information was collected on where people were most likely to buy different types of products and they were costed accordingly. For example, a main weekly shop was costed in a major food retailer in the Irish market, meat costs were based an average butcher price for the local areas and the cost of milk and bread purchased outside of the main food shop was based on average prices in local convenience stores. The unit cost of food items which were purchased less than once a week were divided by their expected lifespan in weeks to attain an average weekly cost.
In 2012 a review of the 7-day menus for all households in rural and urban areas took place as part of a larger review of all household budget items to identify if they were still appropriate for a MESL. Few changes were needed to the 7-day menus and the menus were costed based on changes in shopping patterns [3]. It is these revised menus that form the basis of this research. The 2012 MESL food baskets generated from the menu plans will be referred to as ‘the socially acceptable’ food baskets for the remainder of paper. It is acknowledged that the food menus and corresponding food baskets are socially acceptable only for the households studied in Ireland.
2.3 Overall cost of the food basket
The total costs of the food basket were determined by applying the annual national Consumer Price Index (CPI)rates for food and nonalcoholic beverages published by the Irish Central Statistics Office (CSO) website [18]. The cost of the 2012 reviewed and re-priced food baskets acted as reference point in adjusting for annual inflation rates for costing overall food baskets in 2014 and 2016.The annual rate from March 2013 to March 2014 was -1.5%, March 2014 to March 2015 was -2.7% and from March 2015 to March 2016 was-0.5%. Restaurants, cafes, fast food and takeaway food are not part of the food and non-alcoholic beverages category and the relevant rate in the CSO database was applied.
2.4 Breakdown of costs food basket by category
In addition to the food and non-alcoholic beverages inflation rates are provided for many different food categories and sub-categories from the Irish CSO [7]. To provide an in-depth analysis of the food basket items, it was deemed more accurate to update the cost of each food item based on the most relevant inflation rate for its relevant food category. Each food item in the 7-day menus was categorised as per Table 2. Eleven of these categories had an inflation rate in CSO database which was applied unless a more relevant category was available. For example, the cost of sausages was updated for inflation using the CPI rate for dried, salted or smoked meat and categorised under the sub-category meat. Overall, 41 different inflation rates were applied to the items in the 13 categories based on the detailed subcategories included in the CSO database [18]. The additional category of snacks and treats (which is not a category used by the CPI) was created based on foods that would be categorised as high fat, salt and sugar in national healthy eating guidelines. Some of these foods were included in categories that were not appropriate for the purposes of this research. For example crisps were included in the vegetable category so for this research the sub-category of crisps was included in the new ‘snacks and treats’ category. The inflation rate for this category was based on the inflation rates for the relevant sub-categories listed in the CSO database. When the overall cost of the weekly food basket was based on the cost of each category or sub-category rather than the overall inflation rate for food and non-alcoholic beverages small differences occurred.
2.5 Cost per child’s age
In order to determine the food costs for a child, part of the cost of the household food basket is allocated to each individual in the household. This proportion is calculated on the basis of the Nelson food scale. which is based on research establishing the distribution of food intake across family members [19]. These quantities were used to estimate the cost per child based on their age. Where small differences occurred between households for individuals of the same age, average values were used. The details of how it was applied is described previously [3].
2.6 Income scenarios
The cost of the minimum essential food basket was presented as a proportion of ‘take-home’ household income. The income scenarios presented give an example of the sum of money a household was most likely to take-home in each scenario in 2014 and 2015. These were calculated using data available from the Irish income tax and social welfare systems.
For working age households the two scenarios were
- Household totally reliant on social welfare payments including the monetary entitlements
- One adult employed and earning the national minimum wage. For the two-parent household type it is assumed that one of the adults is employed full time (37.5 hours per week) while the other parent stays at home. For the one-parent household type it is assumed the adult is employed full time. This is also the assumption for the single adult male household. Additional monetary entitlements including child benefit, back to school clothing and footwear allowance, qualified adult allowance, qualified child allowance, early childcare supplement, family income allowance, fuel allowance, one parent family allowance were also accounted for as take-home income. The availability and amount varied by household type and employment status.
For pensioner households, a two income scenarios are examined:
- Contributory State pension
- Non-contributory State pension- a means-tested payment for people over the age of 66 who do not qualify for the higher rate contributory State pension, or who only qualify for a reduced pension based on their social insurance record.
Any additional entitlements, potentially including the Household Benefits Package and qualified adult allowance were accounted for. It was assumed the pensioner households have no other sources of income.
All changes to state benefits between 2014 and 2016 were included in the calculations of take-home household income. These included an increases in the national minimum wage (from €8.65 to €9.15 per hour), in Child Benefit (five Euro each month), in the Family Income Supplement thresholds; in non-contributory and contributory State pensions; and in fuel allowance.
3. Results
3.1 Cost of overall food basket
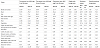
The absolute monetary costs (€ per week) of a socially acceptable food basket for the six household types, in both rural and urban locations is given in Table 3. Food costs decreased between 2014 and 2016. Households with two children had the highest food costs (€125 and €138 in 2014 for households with two adults and two children aged three and ten years in urban and rural settings respectively) and costs increased for households with older children (€150 and €165 in 2014 for households with two adults and two children aged 10and 15yearsfor urban and rural settings respectively).
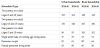
Food costs were higher in rural areas compared to urban areas, with the exception of the single adult male living alone. Those in rural areas purchase more of their food in local convenience stores which tend to be more expensive than large food retailers.Unlike the other households studied, the urban and rural single adult demonstrate greater differences in their consumption pattern. Single male participants in the rural area tended were older than the urban single adult participants to reflect national statistics. Consequently, differences in costs are due to some difference in the composition of the basket and not simply different costs associated with living in an urban versus rural area. The eating out of home costs were higher in urban areas than rural areas for the single male participants.
3.2 Cost of overall food basket relative to take-home income
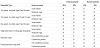
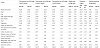
A socially acceptable food basket represented between 17 and 38% of take-home income depending on the household type and was higher for most rural households than those in urban areas (Table 4). Food costs represented the lowest proportion of take-home income for the pensioner couple and the highest for the two-parent, twochild household with the teenage child. Employment status had a big impact on the percentage of household income required for the food basket, such that the proportion of take-home income required for food costs was greater for family households totally dependent on social welfare than those receiving the minimum wage. For pensioner households, the pensioner couple had to spend a lower proportion of their take home income compared to a single pensioner female due to relative lower food spend per person for the pensioner couple.
3.3 Breakdown of costs by food category
The weekly cost (€) of the each food category of the food basket is presented in Tables5 and Table 6(a) for urban and rural households, respectively. These costs which were adjusted for inflation rates for individual food categories demonstrate that the decrease in overall cost of food from 2014 to 2016 was largely attributable to decreases in items such as bread, cereals and meat. The most expensive food category for the majority of households was meat, followed by fruits and vegetables combined. The cost of social eating i.e. eating out of home and or having extra foods for visitors was similar for households living in urban and rural areas except for the single adult male. The single adult male living rurally spent two thirds of that spent by the urban single male on social eating.
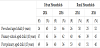
3.4 Cost of food by child’s age
The data on weekly food costs for children of different ages is presented in Table 6(b). It shows that the food costs increase by age and doubles between the pre-school years and post-primary years. Food costs for a child in rural areas where higher than in urban areas.
4. Discussion and conclusions
The research established the cost of a minimum essential food basket for six household types inIreland between 2014 and 2016. The cost was found to be determined by where the household lived, the presence and age of children in the household, and on the employment status of the household. This novel consumer-led approach to estimating the cost of a healthy food basket supports previous research that shows low income households have to spend a greater proportion of their available income on a healthy food basket compared to higher income households [10]. It highlights the financial challenge faced by low-income households with a large proportion of take-home pay, between 15 and 36%, being required for a socially acceptable and nutritious food basket. The Household Food Budget, which is based on a representative sample of the Irish population, provides data on the average expenditure of Irish household on food [1]. However, the costs generated in the current paper relate only to low income households and show a higher percentage take-home income required for food. For example, a two parent household with younger children spent €143 or 17% of core expenditure on food in the HBS data compared tour research which showed the equivalent urban household spent €121 or 25% of core expenditure of food.
The current research demonstrated that food costs double for children between the ages of 3 and 15 years. The households with a 10 and a 15 year old, living on a rural location and reliant on social welfare, required as much as 38% take-home income in 2014 to buy a socially acceptable and nutritious food basket. This is a large proportion of household income for a menu that cannot be considered luxurious. Child benefits are issued in Ireland per child at a fixed amount regardless of the child’s age. The background MESL research shows that in addition to food, teenagers contribute to additional costs for households e.g. clothes, education, social participation. Age was also a factor in composition of the food baskets for the single adult male but overall it had little impact on the cost and proportion of take-home income for families.
The impact of employment status i.e. income source, had a major impact on proportion of household income required for a food basket. For example an urban one parent household reliant on social welfare had to spend almost twice as much of their household income compared to the same household where one adult was in full-time employment. It had a bigger impact than location. The cost of the socially acceptable food basket is higher for all rural household types, except the single adult male living alone. As previously stated this is due to a higher reliance on shopping in local convenience stores.
The current research supports previous data showing meat is the most expensive food category in the food basket followed by fruit and vegetables [10]. Processed meats are cheaper than lean cuts of meat and dietary intake data demonstrates that intakes of processed meats are higher for individuals from a lower socio-economic background in Ireland, as is fruit and vegetables [2]. Low intakes of fruit and vegetables and processed meats are associated with higher incidence of NCDs [20].
The current data provide a solid foundation to establish actual healthy eating costs on an ongoing basis for low income families in Ireland and supports the findings from qualitative research showing that achieving healthy eating guidelines is financially challenging for those on a restrictive household budget [2,13]. It is important to recognise that for many households there will be constant pressures on the household budget and addressing income adequacy is one aspect of supporting households on low income. It is important to clearly recognized that food poverty is associated with many other factors including health beliefs, food and cooking skills and other environmental factors [21]. Therefore it has to be recognized that addressing income adequacy for low income households is only part of the solution of addressing food poverty.
The strength of the current approach to costing food baskets for different households is that the original menus were developed from the outset by members of the general public. The MESL food baskets reflect the behaviour and shopping patterns of members of the public and reflects the basic need for households to participate in psychosocial aspects of food with family and friends, practices considered to be a normal part of everyday life. Nutrition researchers often consider food purely from a nutritional or biological perspective. This perspective limits the acceptability and translation of research outputs for the general public.
Within the EU the importance of using reference budgets for drawing up requirements of a minimum income scheme and addressing adequacy is recognised [22]. In addition to Ireland other countries that have developed reference and food budgets include the UK, Netherlands, Austria, Finland and Belgium [23]. There is scope for extending the use of this methodology to other EU countries and using the data to highlight the issue of food poverty.
Competing Interests
The authors declare that they have no competing interests.