


1. Introduction
Goat milk makes a major contribution to the economic and nutritional well-being of humanity in many parts of the world, including the Mediterranean basin, Middle East, Eastern Europe, South America, and numerous developing countries [1] . In other developed countries, a growing interest in a healthier lifestyle has raised the historically low levels of goat milk consumption [2] , attributable to its nutritional and health benefits and greater digestibility and lower allergenic potency in comparison to bovine milk [3,4]. Spain retains an excellent goat genetic heritage of highly rustic native strains and productive lines selected from other breeds, and traditional milk production methods are preserved as well as modern optimized processes.
Goat milk is mainly used for fresh liquid consumption or the manufacture of fermented milks and cheeses. The chemical composition of any type of fresh milk changes over time, varying according to the lactation stage, animal age, breed, milking intervals, season of the year, ambient temperature, and nutrition, among other factors [5] . Goat milk has lower lactose content in comparison to bovine milk, making it more suitable for individuals with lactase deficit [6] . Goat milk is also considered to offer greater digestibility and biological value, because it forms a smaller, softer, and less persistent clot in the stomach, favoring the action of digestive proteases [7-10]. Goat milk also has a lower content of the αS1-casein protein fraction, one of the main allergens in bovine milk [11] . In addition, the fat globules are smaller than in bovine milk, improving their dispersion and homogeneous distribution and reducing the gastric and intestinal transit time [7,12,13]. Caproic, caprylic, capric, myristic, and palmitic acids are the main fatty acids in goat milk [13,14].
The mineral content of goat milk was reported by some authors to be higher and in a more available form in comparison to bovine milk [15] . Milk and by-products are known to be important sources of highly available Ca, attributable to their Ca absorption-stimulating components, such as lactose, citrates, and casein phosphopeptides [16] . Milk is also free of antinutrient factors, such as oxalates, phytates, or fibers, which inhibit Ca absorption [4,17,18].
Fermented milks, including yogurts, are a good source of other minerals besides Ca, including P, K, Mg, Zn, and I [15,19,20]. Fermentation does not alter the mineral content of milk, but the resulting lactic acid enhances the absorption of Ca and probably that of other minerals such as Fe, Cu, and Zn. This effect is known to be related to the formation of soluble complexes with the ionic forms of these minerals [21] . The fermentation process is also known to enhance protein hydrolysis, increasing the levels of peptides, amino acids, and other products that can also promote absorption of minerals by forming soluble chelates with them [21] .
Production of high-quality fermented milk products requires control over several factors, including the chemical composition of the raw milk, the type of milk, the processing conditions, and the starter culture used for the fermentation [22] . Few data are available on the influence of the manufacturing process on the mineral content of fermented goat milk products. The development of goat milk byproducts is of major current interest due to the above-mentioned increase in demand for the beneficial nutritional properties of this milk [23,24]. In the present research, we investigate the effect of goat milk processing on mineral (Zn, Ca, Mg and P) content. The study hypothesis was that milk processing and fermentation process would affect the levels of minerals in goat milk products. The study objectives were i) to determine the influence of the fermentation method on the Zn, Ca, Mg, and P levels in commercial goat milk products, measuring Ca, Mg, and Zn levels by atomic absorption spectrometry (AAS) and P levels by visible ultraviolet (UV-VIS) spectrophotometry for; and ii) to compare the effect of using different microorganisms for the manufacture of fermented goat milk products on the content of these minerals.
2. Materials and Methods
Milk and fermented milk samples: A total of 47 samples were studied from three types of goat milk: raw milk (n= 25) directly obtained from farmers in Southern Spain (province of Granada); commercial milk (n= 10); and commercial fermented milk (n= 12). All samples were carefully handled to avoid contamination, and the appropriate quality assurance procedures and precautions were followed to ensure the reliability of results (Table 1).
The influence of the labeled probiotic starter cultures on Zn, Ca, Mg, and P levels was studied in two sub-groups of goat milk products fermented with: (a) traditional bacteria used to manufacture yoghurt [Lactobacillus delbrueckii spss. bulgaricus (LB) and Spreptococcus thermophilus (ST)]; or (b) probiotic starter cultures used to produce kefir and other fermented goat milk products (LB + ST + different species of Bifidobacterium and/or different species of yeasts and/ or L. casei and/or L. acidophilus). Mineral levels in the commercial fermented goat-milk products were compared with those in the raw and commercial goat milk.
The possible influence of the processing of goat milk on its mineral content was analyzed and compared in samples from raw and commercial goat milk and from two groups of commercial fermented milk.
Chemicals: Standard solutions of Zn, Ca, Mg, and P (1000 ± 0.002 mg/L) (Tritisol, Merck, Darmstadt, Germany) were used and diluted as necessary to obtain working standards. High quality concentrated nitric acid (65%) and perchloric acid (65%) were used for sample mineralization. All reagents used were of analytical grade. A chemical modifier (LaCl3) was employed for Ca measurements. All solutions were prepared from analytical reagent-grade chemicals (Suprapur, Merck, Germany).
Apparatus: A Perkin-Elmer 1100B double beam atomic absorption spectrometer equipped with deuterium-arc-background correction (Perkin-Elmer, Norwalk, CT, USA) was used. Measurements were performed at a wavelength of 213.9 nm for Zn, 285.2 nm for Mg, and 422.7 nm for Ca, using hollow cathode lamps (Perkin-Elmer). A Selecta multiplace digestion block (Selecta SA, Barcelona, Spain) and Pyrex tubes were used for sample mineralization. Bidistilled deionized water with a specific resistivity of 18 MΏ cm-1 was obtained with a Milli-Q system (Millipore, Milford, MA). P was measured with a Perkin Elmer Lambda 3B spectrophotometer (Norwalk, CT, USA) at a band-pass setting of 1 nm using a method previously developed by our research group (Norwalk, CT, USA) [25] . The optical density of the resulting color was measured spectrophotometrically at 750 nm.
Sample preparation and analysis: A portion of 2 g of homogenized sample was treated with 3 mL of an HNO3•HClO4 (4:1) mixture in Pyrex tubes placed in the digestion block and was then heated at 60°C for 30 min, 90°C for 30 min, and 120°C for 45 min. The solutions obtained were cooled to room temperature, transferred to a calibrated flask, and diluted to a final volume of 25 mL with bidistilled deionized water. All analyses were done in triplicate.
The analytical procedures employed for the mineralization and determination of the Zn, Ca, and Mg levels by flame atomic absorption spectrometry (FAAS) were similar to those previously optimized and published elsewhere [26,27,28]. Zn, Ca, and Mg determinations were carried out by direct aspiration into the flame of the atomic absorption spectrophotometer. Ca levels were measured by the standard addition method to avoid matrix interferences [20,26], while Zn and Mg were determined by the linear calibration method. All samples and blanks were mineralized and diluted using the same procedure. Data were corrected for blank values, which were usually very low with these methods. P levels in the mineralized samples were determined with a previously developed UV-vis spectrophotometric method [25] . The optical density of the developed color was measured spectrophotometrically at 750 nm using a Perkin Elmer Lambda 3B spectrophotometer (Norwalk, CT, USA) with a band-pass setting of 1 nm. The optical density in each sample was correlated with the P concentration by the linear calibration method [20,25]. All samples and blanks were mineralized and diluted in triplicate using the same procedure.
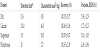
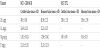
The analytical characteristics of the methods used to measure Zn, Ca, Mg, and P were evaluated, establishing the detection limit and sensitivity (Table 1) for these elements. The inter-day repeatability and the percentage recovery of added Zn, Ca, Mg, and P were adequate for the measurement of these elements in goat milk and its by-products (Table I). The accuracy and precision of the Zn, Ca, Mg, and P measurement procedures were also verified by testing two certified reference standards: CRM 063R skim milk powder (Community Bureau of Reference, Commission of European Communities) and SRM 1572 citrus leaves (National Institute of Standards and Technology). Non-significant differences were found between the mean Zn, Ca, Mg, and P concentrations determined in these materials and the certified concentrations (Table 2).
Statistical analysis: PSS 15.0 for Windows (IBM, Chicago, IL) was used for the data analyses. Results were expressed as arithmetic means ± standard deviation (SD). The normal distribution of variables and the homogeneity of variances were verified by applying the Kolmogorov-Smirnov and Levene’s tests, respectively. The ANOVA and Kruskall-Wallis tests were used for comparisons of parametric and non-parametric data, respectively. The Duncan multiple range test was also applied. Linear correlations among mineral levels were established by means of the Pearson or Spearman tests for parametric and non-parametric data, respectively; p < 0.05 was considered significant in all tests.
3. Results and Discussion
Zn concentrations in goat milk and by-products. Mean Zn content in the raw goat milk was 3.43 ± 0.24 μg/g (Table 3), within the range reported in food composition tables (from 3.0 to 5.0 μg/g). Reported Zn levels in raw goat milk include: 2.97-3.76 μg/g [29] , 5.6 μg/g [10] , 5.2 μg/g [30] , and 3.6 μg/g [31] .

As shown in table 3, mean Zn levels were significantly higher in the commercial goat milk samples (4.41 ± 0.05 μg/g) than in the raw milk, likely related to the different origins of the samples. The mean Zn concentration in the commercial fermented goat milk samples (4.24 ± 0.34 μg/g) was different from previous reports on fermented goat milk [3.37 [32] , 4.0 [33] , and 4.50 μg/g [34] .
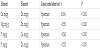
Application of the Duncan multiple range test revealed a significantly lower mean Zn concentration in raw goat milk than in commercial goat milk or commercial fermented goat milk (Table 3) (P < 0.005). Comparison among fermented goat milk products, which used different fermenting microorganisms (Table 4), showed a significantly higher mean Zn value for the fermented goat milk product (LB + ST + different species of fermenting bacteria) (Table 4).

Zn concentrations showed a significant linear correlation (P < 0.005) with the Ca, Mg, and P concentrations in the different goat milk samples (Table 5), which was positive with Ca and negative with P and Mg concentrations. Further research is required to elucidate these correlations.
Ca concentrations in goat milk and by-products: The mean Ca level was slightly lower in the raw goat milk (1.205 ± 0.455 mg/g) than in the commercial goat milks (1.274 ± 0.189 mg/g). It was similar to the results of Le Mens [29] in raw goat milk (from 1.199 to 1.272 mg/g) but lower than the findings of other researchers [1.216-1.555 mg/g [35] ; 1.340 mg/g [10] ; 1.586 mg/g [30] , 1.382 mg/g [36] , and 1.620 mg/g [31] .
The mean Ca concentration in the commercial fermented goat milk products (1.975 ± 0.432 mg/g) (Table 3) was higher than values reported by other groups [1.210-1.330 [35] , 1.048 [37] , and 1.455 mg/g [38] . The mean Ca level was significantly higher (P = 0.003) in the commercial fermented goat milk produced with species of probiotic starter bacteria (Table 4). Variations in Ca levels among different milk goat products are the result of differences in the breed, season of the year, ambient temperature, and/or geographic origin [23] .
Mg concentrations in goat milk and by-products: The mean Mg concentration was significantly higher in raw goat milk samples (132.9 ± 5.52 μg/g) than in the commercial milks (109.5 ± 8.73 μg/g) (Table 3, P < 0.001). Similar levels have been reported by other authors in raw goat milk samples [129.2 μg/g [30] , 133.0 μg/g [35] , 118-165 μg/g [29] , while Mestawet et al. [31] reported a higher Mg concentration of 150.0 μg/g. In some food composition tables, the Mg concentration in goat milk ranges from 140 to 200 μg/g [39,40,41].
No significant difference in mean Mg level was found between the two fermented goat milk products produced using different fermenting microorganisms (Table 4). Reports on Mg levels in fermented goat milk products have ranged from 123 to 149 μg/g [32,33,35,37,40], and were similar to the present finding in commercial fermented goat milk (128.48 ± 44.02 μg/g).
P concentrations in goat milk and by-products: The mean P concentration was significantly higher in raw goat milk (1.188 ± 0.084 mg/g) than in the commercial goat milk (1.028 ± 0.102 mg/g) (P = 0.001). Other researchers have reported varying levels in raw goat milk [0.878-0.933 mg/g [29](Le Mans, 1993), 1.210 mg/g [42] ; 1.897 mg/g [30] ; and 1.390 mg/g [31] . Food composition tables have described mean P values in raw goat milk of 0.950 mg/g [39] and 1.030 mg/g [43] . The mean P level was significantly higher in the commercial goat milk than in the commercial fermented goat milks (Table 3). No significant difference in mean P level was found between the two commercial fermented goat milk products (Table 4). As observed for Zn levels, P concentrations in goat milk and by-products were significantly and negatively correlated with Ca and Zn levels (P < 0.005) (Table 5). Although only a small number of goat milk fermented products was studied, they represented all of the commercial brands available in the supermarkets of the city of Granada (Southern Spain).
4. Conclusions
This study contributes valuable nutritional data on mineral (Zn, Ca, Mg, and P) levels in raw, commercial, and commercial fermented types of goat milk. They are useful for updating food composition tables, which often contain inadequate information on the concentrations of these minerals in new fermented functional foods, including commercial goat milk products fermented with different probiotic microorganisms. P and Mg concentrations were significantly higher in processed goat milk than in raw goat milk, whereas Zn concentrations were significantly lower. Zn and Ca concentrations were significantly higher in commercial fermented goat milk than in raw goat milk, whereas P concentrations were significantly lower. Mean Zn and Ca concentrations were significantly higher in the commercial fermented goat milk produced with different species of probiotic starter bacteria. This is one of first studies to report that processing and fermentation influence Zn, Ca, Mg, and P concentrations in goat milk. These findings should be considered when daily dietary intakes for these elements are estimated.