


1. Introduction
Multiple sclerosis (MS) is a chronic inflammatory disease of the central nervous system that causes disability in population [1,2]. MS has a variable prevalence that oscillates from high levels in North America and Europe (> 100/100000 people) to lower ones in Western Asia and Sub-Saharan Africa (2/100000 people) [3]. The age of onset of disease is between 20 and 40 years, even if about 85 per cent of those who are newly diagnosed have a relapsein MS [4,5]. Four disease types can be recognised: relapsing–remitting MS (RRMS), primary–progressive, secondary–progressive, progressive–relapsing MS and clinically isolated syndrome (CIS) [6]. The approved drugs for MS treatment decrease the frequency of relapsing and delay the progression of disability [7]. The drugs currently in use are the disease modifying drugs (DMDs): interferon beta 1b (SC) (Betaferon®, Extavia®), [8] interferon beta 1a [Avonex®(IM), Rebif®(SC)] [9,10]. Glatiramer Acetate (SC) (Copaxone®), [11,12] fingolimod (Oral) (Gilenya®), [13-15] teriflunomide (Oral) (Aubagio®), [16,18]. (Oral) dimethyl fumarate (Tecfidera®) [19], natalizumab (Tysabri® (EV), [20] peginterferon beta 1a (SC) (Plegridy®) [21]. Clinical benefits by using these drugs are evident, but there are many problems related to administration pattern and to therapy chronicity [22,23], especially for self-administration. These parameters influence the adherence and the efficacy medication [24-27]. Especially for the chronic condition the medication adherence is affected by routine of theraphy. The World Health Organization defined poor adherence to medication prescribed as a global problem that can lead to increase morbidity and mortality [28]. The non-adherence ratio to DMDs for MS was investigated and several results were published. Treadaway et al. found that 40% of patients were non-adherent in the first 4 weeks [29]. Other studies described that the discontinuation rate for IFN-β and Glatiramer was from 17% to 46% in 4 years real world setting [30–33]. When the adherence was investigated with patient questionnaire the values seem higher than obtained with other method. In fact the adherence ratio was higher of 80% [34,35]. This value is similar when the adherence was calculated as Proportion of days covered (PDC) [36,37]. The primary outcome of this study was the analysis of medication adherence, the persistence to treatment, the changing of adherence in function of persistence and the % of therapeutic switch in patients affected by MS. The secondary outcome was to evaluate the cost per RDD per drug by comparing the oral treatment with parenteral one.
2. Subjects and Method
This cross-sectional study was carried out in the hospital pharmacy of Pescara. All the patients affected by MS from the 1st January 2007 to the 31st December 2015 were involved in the study. The drugs analysed were Avonex®, Rebif®, Betaferon®, Extavia®, Copaxone®, Gilenya®. Aubagio® and Tecfidera® were been considered for only analysis of switching because they are been introduced in market recently. According to the Italian law, no ethical approvals required to perform this type of analysis and no informed consent from patients is needed. At every single refill, for all patients the hospital pharmacists recorded the following parameters on “pharmadd.it”, a software created ad hoc for drug-utilization studies: name, surname, age, sex, drug, date of refill, refilled quantity and therapeutic switch. Only patients in treatment at least six months were considered. The medication adherence has been calculated by using the method of ratio between weighted average of Received Daily Dose (RDD) and Prescribed Daily Dose (PDD) [38]. The RDD represents the ratio between the dose refilled and the number of days elapsed between two subsequent refills [39,40]. The PDD is the dose prescribed by the clinician [41,42]. The cost per RDD is estimated according to the ratio between the cost sustained by the Local Health Unit and the unit of measure as indicated by Defined daily dose (DDD), as well as below.
The rate of adherence in function of time was calculated by doing the average of the adherence of individual patients at 30-day intervals and plotted by placing the time factor on the abscissa axis and the adherence on ordinates axis.
3. Analysis
In descriptive analysis, pairwise comparisons using t tests, Chi-squared tests and log Rank test were conducted comparing curves of persistence and adherence. P values were compared with an a priori alpha 0.05 to determine statistical significance. Analysis were conducted with Graph pad prism 6.0.
4. Results
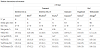
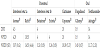
The number of patients, average age, sex, cost per RDD, and the medication adherence about the drug are in table 1. 229 patients were analysed treated with all the drugs included in the study from a minimum of 20 patients for teriflunomide to a maximum of 94 for interferon beta 1a shared between Avonex® (45,75%) and Rebif®. Average age oscillates between a minimum of 41 years to a maximum of 51, with values that varies from 20 to 69 years. Female population isthe most affected with an average ratio of 1/3. Weighted average of RDD and PDD were calculated for every drug (Table 2). It is shown the DDD tabulated for all the drugs included in the study in order to estimate the difference with the prescribed dose.
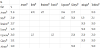
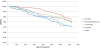
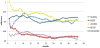
In table 3 were described the therapeutic switches underlining the % of second line medications. The % of discontinuation of treatments varies from a minimum of 10% for teriflunomide to a maximum of 51.16% for Avonex®. The 40.91% of patients leave the therapy with Avonex® to use Rebif® demonstrating the importance to increase the dose. In fact the patients move from a PDD of 4.29μg to 18.53 μg triplicating the daily dose. Switching to a second line treatment it is motivated by the loss of effectiveness of the first line one [43] and occurrence of side effects. The patient treated with Rebif®, Betaferon® and Extavia® switched treatment in favour of the oral therapy with a per cent of 25.49, 28.57 and 14.29%, respectively. Those treated with Copaxone® have switched for the 28% of which 50% in favour of oral therapies. That switch over to a greater effectiveness of the new oral administration drugs [44,45] also has an higher acceptability by the patient and a greater adherence [46,47]. The levels of adherence to treatment are shown in figure 1 and oscillate between a minimum of 0.81 for Extavia® and a maximum of 0.91 to Avonex®. The persistence to treatment for the study drugs calculated at 3 years is plotted in figure 2. There were not significant differences between all drugs analysed (Logranktest, 95% CI, Chisquare 1.057, P value: 0.3039). The drugs with a greater persistence were Rebif® and Extavia® / Betaferon® with a % of the 64 and 62, respectively. Following Gilenya®, Copaxone® and Avonex®, respectively with values of 59, 40 and 45%. The ratio between adherence and persistence is plotted in figure 3. The analysis was conducted in 3 years. There was significant difference between the Avonex® curves and the others drugs. (t-test, 95% CI, P value <0.0001). The drug with the best ratio is Avonex® that never presents values below 90%, while Rebif® has the worst profile, with adherence values always below 85%. Finally, the costs per RDD were calculated for the analysed drugs and it oscillates between a minimum of € 13.66 for Betaferon® to a maximum of 44 € for Gilenya®.
5. Discussions
In observational analyses of administrative claims data, medication adherence is measured frequently with a medication possession ratio (MPR) or proportion of days covered (PDC). These variables measure the time in days in which the patient is covered by drugs. [48] The days covered of drug are linked to standard dose, DDD, according the following formula:
As reported by Sinnot et al., the use of DDDs to evaluate the medication adherence can overestimate or underestimate the drug exposure according to the pathology analysed [49]. The DDD does not represent the physician intention to treat and is possible to use it to evaluate medication adherence only when coincides with PDD.
In this study medication adherence is evaluated using the parameter of drug utilization RDD and PDD. RDD describes the patient behaviour to therapy (administration) while PDD represents the dose prescribed by the clinician. In many cases the PDD coincides with the DDD that represents the average dose of medication to be taken daily for the primary indication [50]. In the case of MS, as shown in Table 3, the PDD coincides with the DDD for all drugs except interferon beta 1 a. For Avonex® DDD matches with PDD while Rebif® is about three times higher. For this reason, both in adherence calculation and in the calculation of the cost of treatment is most appropriate to consider the PDD that provides a more reliable parameter and adherent to reality. From the calculation of adherence to treatment the drug with the best profile is Avonex®. This result can be explained by a simpler dosing regimen with an administration every 7 days compared to other drugs both administrated parenteral and orally. From this analysis, adherence to oral therapy is similar or lower than the parenteral one, Gilenya® 0.89 - Aubagio® 0.83 vs. 0.81 Rebif, 0.93 Avonex, 0.82 Betaferon® / Extavia®, 0.90 Copaxone®.
The adherence rate of DMDs were similar to the published one [51,52]. Considering the differences in terms of adherence and persistence, the profile of oral therapy is comparable to parenteral one, the only discriminant is represented by the daily cost as cost per RDD where the fingolimod has a considerably higher cost than the other in the study. Another important aspect in chronic therapies and especially in MS is the therapeutic switches that may have different motivations, from therapeutic failure to improve patient compliance. [53] The 51% of patients leaves the Avonex to move to Rebif®. Considering that Avonex has an higher adherence compared to Rebif®, the passage can be motivated by the loss of effectiveness and the need to treat patients with higher doses, changing the dosing regimen and influencing the adherence to the treatment. Talking about the oral administration there is a massive shift in favour of fingolimod clinically justified by a greater effectiveness [54,55] but not by a better adherence, which in fact tends to be affected by the time function, as shown in figure 3. The adherence profile in function of persistence shows a steady increase from 89% in the first month to 94% in the twelfthone before falling steadily.This aspect could be explained by the repetitiveness of daily oral administration which tends to become monotonous and therefore it causes a loss of adherence over time.
6. Conclusions
From the analysis conducted on the use of disease modifying drugs used in MS therapy, it results a good adherence for all the analysed drugs. There is a management problem of therapy that is underlined by the switch of the therapy and the persistence to treatment. The better adherence profile of Avonex® compared all drugs shows as the dosing schedule (once weekly) increase the terms of adherence. From the pharmacoeconomic analysis, calculated considering only the cost of the drug based on the actual use, it results a two fold cost of fingolimod compared to oral and parenteral competitor that does not seem to be justified considering the use of other therapeutic options with oral administration.
7. Study Limitations
Limitations include small sample sizes, single-centerstudies, and geographically restricted populations.
Competing Interests
The authors declare that they have no competing interests.