


1. Introduction
The introduction of Acetylcholinesterase inhibitors (AChEI) as a symptomatic treatment of Alzheimer’s disease (AD) has made patients seek medical advice at an earlier stage of the disease. This circumstance has highlighted the importance of diagnostic markers for early dementia, that indicates progressive dementia, such as for Alzheimer`s (AD), and Lewy body dementia (LBD). However, there is no clinical method to determine which of the patients with mild cognitive impairment (MCI) that will progress to AD and LBD dementia, or have a benign form of MCI without progression. To foresee, which patients with suspected dementia that will develop Alzheimer`s or Lewy body dementia, different methods in clinical practice, e.g., Cerebrospinal fluid (Csf) biomarkers, mini-mental score examination (MMSE), quantitative EEG (qEEG) and different neuroimaging methods used. At an early stage of the dementia disease no definite specific diagnosis could be determined, therefore was the objective for this study to follow cognition by MMSE scores in patients and compare with baseline values for the biomarkers and identify which of those that best reflected the decline of MMSE scores [1] indicating a progressive primary dementia disease.
For the qEEG variables, a decrease in EEG peak-frequency [2-5] and alpha power [6-14] are consistent with cognitive impairment and AD, as well as significantly reduced desynchronization at eyeopening for AD patients compared to healthy subjects [5] . A recent study evaluating EEG power changes and average peak-frequency in healthy subjects and suspected dementia patients found a statistically significant reduced Vigilance-index (quota E.O. / E.Cl. mean-power) and EEG peak-frequency for the suspected dementia group [15] . The Vigilance-index reflects the cholinergic status and could be shown to be affected by Acetylcholinesterase inhibitor medication in a positive direction, hindering further decrease in primary degenerative dementia, which known to decrease in Alzheimer`s dementia [15-23] . This circumstance could potentially lead to earlier identification of those patients developing AD and LBD as well as the initiation of Acetylcholinesterase inhibitor treatment earlier in the course of the disease than previous EEG methods [5,24-30].
The current view of clinically used Csf biomarkers is that they can predict patients that develop AD in an MCI cohort [31-38] and the Csfbiomarkers pathological values precede clinical signs of Alzheimer`s disease in MCI patients [35,36,38-40]. The Csf biomarkers; total-Tau, phospho-Tau and Amyloid β-42 reflects different aspects of neuronal damage in the disease process leading to Alzheimer`s and Lewy-body dementia, these variables evaluated separately in this study. Some scientists claimed that all of these variables ought to be pathologic as diagnostic criteria for those MCI patients that develop Alzheimer`s disease; also, this combination evaluated [34] .
2. Materials and Methods
A cohort of 49 patients, 66-92 years of age (mean age 71.2 years) investigated at a memory clinic for suspected dementia. The cognitive status measured with MMSE scores at baseline and follow-up after an average of 23.2 months (SD 4.0), qEEG, Csf biomarkers; Amyloid β-42, total-Tau and phospho-Tau were measured at baseline.
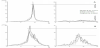
MMSE higher than or 28 of 30 scores regarded as normal cognition [1] but a pathological value of < 26 used in the evaluation to ensure that cognitive disturbance was revealed [41] . The standard value for the average frequency of EEG, 8-13 Hz used, and the quota of average power for Vigilance-index below 0.3 used to reflect the normal cholinergic status (Figure1) [15] . The pathological values for Amyloid β-42: lower than 550 ng/liter, total-Tau: more than 400 ng/liter and phospho-Tau: more than 80 ng/liter in Cerebrospinal fluid.
The EEG:s were recorded and analyzed using standard digital EEG equipment (Nervus™ 5.3 digital EEG system, Viasys Healthcare, Inc., San Diego, California, United States). The recorded analog signal with a sampling frequency of 128 Hz, was converted to a digital signal by Fast Fourier transformation (FFT).
EEG:s recorded at awake patients, sitting on regular chairs and instructed to open eyes for 30 seconds and close eyes for 90 seconds, four of these EEG epochs with eyes closed and with eyes open analyzed and an average value calculated for respective eyes opened and eyes closed epochs. This procedure ensured alertness and vigilance of the patients, which also monitored by the EEG assistant during the recording session. A few patients and parts of the EEG recordings that showed signs of drowsiness, and patients who were very tense or nervous with low EEG amplitudes during eye-closure comparable to magnitudes at eye-opening [42] , were excluded from the analyses. Four of the recorded EEG epochs with eyes closed and with eyes open used. Approximately eighty seconds of eyes closed epochs and twentyfive seconds of eyes open epochs were analyzed. The first ten seconds were excluded from the closed eyes epochs, for avoiding analyzes of arousal reaction and eye movement artifacts, and of the similar reason, the first three seconds omitted of the open eyes epochs. Rarely slightly shorter epochs analyzed, due to brief episodes of recording interference.
Average peak-frequency and peak power for the four eyes closure epochs and the four eyes open epochs calculated. The average peak power for eyes open epochs measured within ± 1 Hz deviation from peak-frequency for eyes closed epochs.
The Vigilance-index was calculated from the ratio of the average peak power for eyes open divided with the average peak power for eyes closed (E.O. power / E.Cl. power) to quantify the relative desynchronization of the eyes open EEG epochs (Figure 1). The peak power was defined with an EEG filter setting of 3-15 Hz, covering the alpha and theta frequency bands (4-13 Hz), avoiding analysis of eye movement and muscle artifacts. EEG:s analyzed from the T6 or T5 area (10-20 EEG system) which reflects the posterior part of the temporal lobe, known to be affected by Alzheimer’s and Lewy body dementia and also a part of the cortex where basic rhythm is prominent.
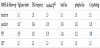
To compare between MMSE scores, Vigilance-index, EEG frequency and cerebrospinal fluid (Csf) content of T-Tau, Phospho- Tau ,and Amyloid β-42 values, respective data transformed into rankdata and to pathologic or non-pathologic values. To compare between MMSE scores, Vigilance-index, EEG frequency and cerebrospinal fluid (Csf) content of T-Tau, Phospho-Tau, and Amyloid β-42 values, corresponding data transformed into rank-data and to pathologic or non-pathologic values. Due to the low correlation coefficient between MMSE values and the qEEG and Csf biomarkers, the data transformed to pathologic or non-pathologic values and sensitivity, specificity, as well as positive and negative predictive values for MMSE and the biomarkers evaluated (Table 1).
3. Results
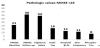
The correlation coefficient of rank value between MMSE and for all variables was low (0.006-0.168), though the highest value for comparison of baseline MMSE and Vigilance-index. At follow-up MMSE, the correlation coefficient was between (-0.049-0.165) and still low though the highest correlations for Vigilance-index and EEGfrequency (Figure 2). This circumstance does not support any apparent linear relationship, so the data transformed to either pathological or non-pathological values in the analysis.
Essential to underline is that the statistical analysis of sensitivity, specificity, positive predictive value, and negative predictive values are not for identifying a diagnose but for MMSE scores, pathological or non-pathological values related to the examined variables. The followup MMSE comparison had the highest sensitivity for Vigilance-index (1.0) while the other parameters had sensitivities between (0.50-0.26) and combined CSF biomarkers lowest (0.09).
Except for Vigilance-index with a specificity of (0.87), the other variables had (1.00) specificity. The positive predictive value (PPV) for Vigilance-index were (0.94) and for the other variables (≤ 0.44) (Table 1).
At the baseline observation, 28/49 had MMSE scores ≥ 26 and at follow-up 13/49 which display a progressive cognitive decline during the observation time for the cohort. The MMSE average score was at baseline 25.5 and at follow-up 22.5 that show a cognitive decline also also for the cohort. When the pathological values between the parameters and the pathological MMSE scores compared, the pathologic values for Vigilance-index best reflect pathological MMSE scores both at baseline and especially at follow-up (Figure 2). The best Csf variable was total-Tau, which only identified approximately half of the pathological MMSE scores (≤ 26) at the follow-up examination, while Vigilance-index identified slightly less pathological values at follow-up than the pathological MMSE scores. The other Csf parameters identified even fewer pathological MMSE at the followup, and the least number for the combined Csf biomarkers (Amyloid β-42, total-Tau and phospho-Tau) (Figure 2).
4. Discussion
The analyzed biomarkers reflect different aspects of cognitive impairment diseases; the Vigilance-index is a biomarker for cholinergic neurotransmitter function and Csf biomarkers for neural damage and pathological Amyloid β-42 deposits in the brain.
Today’s drug therapies with Acetylcholinesterase inhibitors used to hinder the progression of cholinergic deficit and the cognitive decline at suspected dementia of Alzheimer`s disease and Lewy body dementia is generally accepted and based on the assumption of cholinergic deficiency seen early in the course of the disease. The result of this study supports that assumption.
It has been claimed that Amyloid β-42, total-Tau and phospho-Tau shows pathological values early in Alzheimer`s disease [33,35,36,38,39,44,45] , with the biomarkers used by clinicians, no support for that view in this study. No detectable biomarkers may explain the lack of Csf pathological biomarkers for a large proportion of suspected dementia patient due to other causes than Alzheimer`s and Lewy body dementia in the early cognitive decline. Another explanation, the examined cohort of patients is not representing the prevalence of Alzheimer`s disease in a dementia population, which should be approximately 60 % [46] , but this seems unlikely. Another possibility, the Csf biomarkers do not become pathologic early in the suspected dementia disease. Regardless, Csf diagnostics seems ill-suited for the early suspected primary dementia evaluation.
Has this approach of measuring cholinergic status via Vigilanceindex relevance for predicting primary dementia as in Alzheimer`s disease? The observation time was approximately two years, and at baseline examination for suspected dementia had 28 of 49 patients MMSE >25. At follow-up, had the number of patients with MMSE >25 reduced to 13 of 49 (Figure 2), and the average MMSE ratings sank with 3 MMSE scores for the cohort between baseline and follow-up due to a progressive cognitive decline. At this point, no Alzheimer`s or Lewy body dementia diagnoses could be confirmed definitively, but 28/49 patients had measurable cognitive disturbances, and the cohort showed signs of progressive dementia, which preferentially should be due to Alzheimer´s or Lewy body dementia [46] .
Another issue is if other causes were affecting MMSE-scores and Vigilance-index, such as anticholinergic medication that falsely led to a pathological MMSE-scores and Vigilance-index or influences of Acetylcholinesterase inhibiting medication, which potentially decreased the progression of MMSE-scores and Vigilance-index. However, it is unlikely that anti-cholinergic medication initiated in patients observed for suspected dementia, but the opposite, starting treatment with acetylcholinesterase inhibitors is likely, and a significant number of patients was treated during the observation time of this study. This circumstance may probably lead to an underestimation of cognitive decline with pathological MMSE-scores and Vigilance-index at follow-up examination but not likely affect the Csf content of Amyloid β-42, total-Tau and phospho-Tau.
5. Conclusion
The Vigilance-index that measure cholinergic deficit is the most sensitive variable for early prediction of cognitive decline measured by MMSE scores compared to Csf biomarkers of early suspected dementia, preferentially due to primary progressive dementia and with a non-invasive a comparatively inexpensive method. The Vigilance-index can be used to identify responders or non-responders to Acetylcholinesterase inhibitor treatment and initiate treatment early in the course of a dementia disease. Another possibility is to identify other medications with unwanted central anticholinergic effects that gives secondary dementia symptoms.
Competing Interests
The author declare that there is no competing interests regarding the publication of this article.
Acknowledgments
The author thank Gunilla Brohme´ at Nacka hospital, Dr. Maria Norström and Dr. Mats Brådman at Bromma hospital for valuable help getting access to data.
Abbreviations
AChEI: Acetylcholinesterase
inhibitor
AD: Alzheimer’s disease
E.Cl.: Eyes closed
E.O.: Eyes open
LBD: Lewy body disease
MCI: mild cognitive impairment
MMSE: Mini mental score
examination
VaD: Vascular dementia
Vigilance-index: The ratio of the
average E.O. power divided with
the average E.Cl. power.