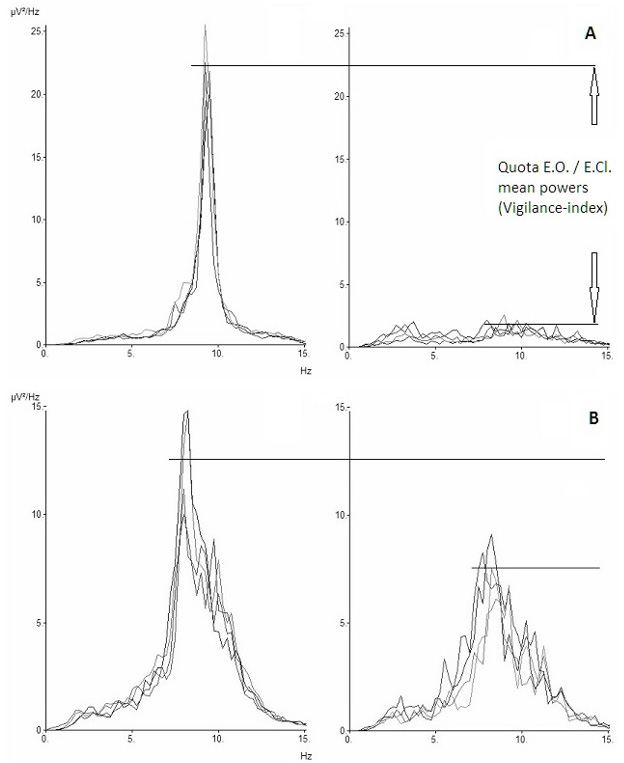
Figure 1: EEG-variables for a healthy person and a patient with suspected dementia at baseline examination. Healthy EEG in the upper diagrams (A), in lower diagrams (B) the graphs illustrated for a patient with suspected dementia. The X-axis shows the frequency (Hz), and the Y-axis shows the power (μV2/ Hz) of four epochs superimposed in the graphs. The left diagrams when eyes closed and the right diagrams with open eyes. The average peak power when eyes closed (E.Cl.) and when eyes are open (E.O.) indicated with horizontal lines in respective graphs. The quota of average E.O. / E.Cl. power (Vigilance -index) calculated from those values and average EEG-frequency from the E.Cl. graphs. Filter settings for the EEG were 3-15 Hz.