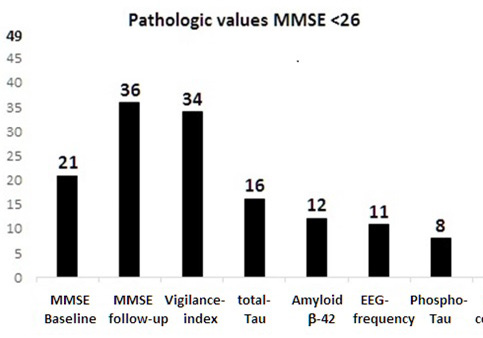
Figure 2: Comparison of pathological values for examined biomarkers. The categories from left marked at X-axis shows the number of patients with pathological values for MMSE <26 on Y-axis, at baseline (first left bar) and follow-up examination after approximately two years (second bar from left). The biomarkers indicated on X-axis, show the number of pathological values from the baseline examination, with the number of pathological values on the top of the bar. Forty-nine patients in total examined.