


1. Introduction
The idea that collective identity and intergroup discrimination are associated may be derived from a number of theoretical perspectives [1-4]. The most prominent of these perspectives is social identity theory (SIT). SIT has dominated most of the work in this area since the mid 1980’s. According to SIT, the self-concept is comprised of personal identities and group (henceforth referred to as collective identities). The former is based on components of the self that are individualistic in nature (e.g., ‘I am good’). The latter is based on components of the self that are derived from one’s membership in social groups or collectives (e.g., ‘New Zealanders are good’). A core assumption of the theory is that people are motivated to achieve a positive social identity. Positive collective identities are achieved through intergroup comparisons. Comparisons which favour the ingroup, lead to positive social identity. Comparisons which favour the outgroup lead to negative collective identity.
In so far as intergroup comparisons often tend to be ingroup favouring (i.e., members of the ingroup are treated more positively and less harshly than members of outgroup) a far reaching consequence of these ideas is that there should be a positive association between intergroup discrimination and collective identity [2].
A number of studies show that, when experimentally manipulated, it is high (rather than low) levels of collective identity, which lead to greater ingroup bias [5-8]. The correlational evidence, which constitutes the vast majority of the evidence in this area is, however, much more inconsistent and contradictory.
In one well know review comprising 14 laboratory, organizational, political and religious groupings, Hinkle and Brown [9] found that although there was considerable variation within studies (with r’s ranging from -.79 to +.55), the overall correlation between identification and ingroup bias across studies was almost zero (+.08).
The nature of the findings reported by Hinkle and Brown has been confirmed in a host of subsequent studies. Several analyses show a clear link between collective identity and intergroup discrimination [8,10-14]. Other work reports little evidence of such relationships [15-20]. Likewise investigations that examine multiple associations (e.g., amongst various groups, positive and negative forms of discrimination, ingroup and outgroup ratings, or diverse aspects of identity) have reported correlations that are sometimes positive, sometimes negative and sometimes essentially zero [3,21-28].
The inconsistent findings in this area have stimulated a good deal of controversy [2,29-31]. Several explanations have been offered to explain the heterogeneous evidence. Some such as Turner [31] have specifically drawn attention to theoretical (e.g., confusing identity salience and strength of identity) and methodological issues (e.g., the reliance on correlational as opposed to experimental designs). Others emphasize collectivist-relational ideologies [9], norms [32], threat [11], the multi-dimensional nature of the collective self [33], and a combination of factors relating to the nature of (a) the outgroup, (b) the comparative dimension, and (c) the perceived status differences between groups [4,29,31].
As noted by Voci [34], it is of interest to note that in spite of the different emphases it is generally agreed that the link between collective identity and intergroup discrimination is context dependent [9,29,31]. A primary aim of the present investigation is to further elucidate the nature of the context in which these relations emerge. In doing this, our thinking is guided by theoretical insights derived from self-categorization theory [31,35]. According to this perspective, the association between collective identity and intergroup discrimination will most likely emerge in contexts where intergroup relations are emphasized. In such circumstances collective identity becomes increasingly salient and intergroup attitudes become depersonalized. Group level behaviour thus becomes possible. The likelihood of finding a relationship between collective identity and intergroup discrimination is subsequently magnified [31].
So far our discussion has largely focused on the context in which the link between collective identity and discrimination is likely to emerge. A second aim of the study is to examine whether the proposed (contextually dependent) link will hold when discrimination becomes increasingly negative (i.e., when positive resources are taken away or when noxious stimuli are allocated). This is an important issue because discrimination in the real world often involves highly negative outcomes [36]. Thus, if a particular social psychological process (and the theory from which is derived) can only contribute to our understanding of mild but not more noxious forms of intergroup discrimination its explanatory power is of very limited value.
Previous research has found little clear evidence of a link between negative forms of intergroup discrimination and collective identity. Positive associations between negative kinds of intergroup discrimination and collective identity have been reported in 2 studies. The first, conducted by Jackson [26] Exp 2, found the most consistent correlations for minority group members. The second, conducted by Amiot and Bourhis [37], found a correlation for low status (but not high status) group members. Some studies have, however, found no such relations [38,20]. Others demonstrate that collective identity is related to positive but not negative forms of discrimination [21,25]. The present investigation by examining the context in which collective identity and negative (as well as positive) forms of intergroup discrimination are linked has therefore the potential to bring some clarity to this area. Four studies were conducted to investigate this eventuality. In Study 1, discrimination was assessed via trait ratings of ingroup and outgroup members. In Study 2, intergroup discrimination was assessed via the removal of positive resources from ingroup and outgroup members. In Studies 3 and 4, intergroup discrimination was assessed via the allocation of white noise to ingroup and outgroup members. In each study a single hypothesis was tested. This hypothesis stated that a link between collective identity and intergroup discrimination would emerge only in circumstances that specifically emphasize intergroup relations.
2. Study 1
2.1 Method
2.1.1 Participants
One-hundred and forty-two people (50 men and 92 women) took part in this study. All were students attending the University of Otago.
2.1.2 Design
The core design of the study was between subjects. In one condition intergroup relations were emphasized (the emphasis condition). In the other condition intergroup relations were not emphasized (the non-emphasis condition). All participants then evaluated ingroup (i.e., New Zealanders) and outgroup members (i.e., Americans) and completed a measure of collective identity.
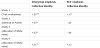
Pilot test: In an attempt to ensure that that the group emphasis manipulation to be used in the following study was useful for the purposes intended, we conducted an independent pilot test. On the basis of SCT which predicts that relatively high levels of social identity salience and depersonalization are necessary for intergroup behaviour to emerge, we examined the extent to which each of these variables were affected in circumstances that emphasized and did not emphasize the intergroup context. Participants (N = 64) were asked two questions. The first assessed identity salience (i.e., ’I identify with the other members of my group’). The second assessed depersonalization (i.e., ‘I am like the other members of my group’). Responses were recorded on 7-point Likert scales (1-strongly disagree, 7-agree strongly). Cell means are reported in Table 1. Between subjects ANOVA’s revealed that amongst participants in the group emphasis condition social identity was more salient (M = 5.72, SD = .96 vs. M = 4.19, SD = 1.90), F(1, 63) = 16. 00, p < .001. η2= .21, and depersonalization was greater (M = 5.66, SD = .87 vs. M = 3.94, SD = 1.60), F(1, 63) = 28.42, p < .001. η2= .31. These findings suggest that the group emphasis manipulation functioned to make intergroup behaviour more likely in the group emphasis condition.
Method and procedure: Following SCT, which predicts that the association between collective identity and intergroup discrimination will most likely emerge in contexts where intergroup relations are, emphasized [31] we sought to draw attention to ingroup and outgroup membership in one condition but not the other. Thus, in the intergroup emphasis condition there was repeated reference to specific ingroups (i.e., New Zealanders), outgroups (i.e., Americans), intra and intergroup interactions. For example, the study was introduced as being concerned with group perception, judgement and behaviour. Participants in this condition were additionally informed that the study was specifically concerned with groups comprised of New Zealanders and Americans. Participants were then required to record the social group to which they belonged (e.g., New Zealander vs. American) on the front page of a response booklet.
It was then explained that after the completion of the booklet there would be a behavioural exercise. This (bogus) exercise was described as one in as which there would be a 5-minute interaction period spent with ingroup members (e.g., New Zealanders) and a 5-minute interaction spent with outgroup members (e.g., Americans). Outgroup members were said to be involved in an identical experiment being carried out concurrently in an adjacent laboratory. Americans were said to be involved in an identical experiment being carried out concurrently in an adjacent laboratory. To underline the reality of this manipulation, a number of additional steps were taken. First, large signs (directing New Zealanders and Americans to separate rooms) were posted in various positions on the way into the laboratory. Second, when members of the New Zealand group were seated in the laboratory, a (confederate) outgroup member entered the laboratory and asked if this was the ‘right room for the American group’. The experimenter then pointed out that “no, everyone here is a New Zealander” and that “the Americans are in the lab next door.” Finally, immediately prior to the start of each testing session a second confederate entered the laboratory and (loudly) informed the experimenter that ‘the American group was ready to begin’. It was explained that both groups had to start the experiment at the same time so that the ‘interaction period’, where the two groups would meet, ‘would coincide’.
In the non-emphasis condition (i.e., where intergroup relations were not emphasized) the study was introduced as being concerned with individual perception, judgements and decision. People in these conditions were given the same instructions and followed the same procedure as those in the emphasis condition except that no reference was made to group membership prior to the presentation of the collective identity scale and the measure of discrimination.
Intergroup discrimination was assessed using 20 pairs of 9-point traitratings scales. Thirteen of these traits utilized the same terms as used in Platow, McClintock, and Liebrand [39]; cooperative-competitive, helpful-unhelpful, selfish-unselfish, intelligent-unintelligent, strongweak, warm-cold, flexible-rigid, manipulative-sincere, fair-unfair, honest-dishonest, friendly-unfriendly, trustworthy-untrustworthy, consistent-inconsistent). The remaining 7 were based on the terms described in Oakes, Haslam and Turner [40] to depict (English, Australian and U.S.) national stereotypes (i.e., loud-soft-spoken, pushy-reticent, humble-arrogant, confident-shy, aggressive-nonaggressive, ignorant-well informed, straight forward-hypocritical). Using these terms, participants were given the opportunity to rate New Zealand ingroup and American outgroup members.
Immediately after the discrimination tasks, participants completed a measure of collective identity. Collective identity was assessed using Luhtanen and Crocker’s [41] 4-item measure of private collective self-esteem (CSE). This scale emphasizes the evaluative component of collective identity and as such is generally considered to be an effective measure of the regard or esteem in which group membership is held. The scale was modified to refer to the New Zealand national identity (e.g., ‘I feel good about being a New Zealander’, Cronbach’s alpha = .80). Higher scores reflect more positive levels of collective identity. Responses were recorded on a 7-point Likert scale (1-agree strongly, 7-disagree strongly). Participants were required to respond on the basis of their feelings in the immediate context.
2.2 Results
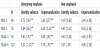
Intergroup Discrimination: A priori analyses indicated no gender differences, so these are not reported. Intergroup discrimination was assessed using a 2 (condition: group emphasis vs. no emphasis) x 2 (target group: ingroup vs. outgroup) mixed model ANOVA. The first variable was between samples. The second variable was within samples. Cell means are presented in Table 2. A main effect was found for target group F(1, 140) = 177.16, p < .001, η2 = .56. Overall the ingroup was rated more positively than the outgroup (M = 119.59, SD = 15.48 vs. M = 96.81, SD = 96.81). This effect was qualified by the interaction found between condition and target group, F(1, 140) = 20.58, p < .001, η2 = .13. Planned comparisons using repeated measures t-tests revealed that participants in the group emphasis t(70) = 11.75, p < .001, and non emphasis condition revealed, t(70) = 6.74, p < .001.
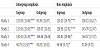
Collective identity: A between samples ANOVA compared the collective identity levels of those in the emphasized and the nonemphasized conditions. As may be seen in Table 3, collective identity was higher in the emphasized condition, F(1, 141) = 7.32, p < .009, η2= 05.
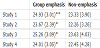
Collective identity and Intergroup Discrimination: The association between collective identity and intergroup discrimination was assessed using correlation. Separate analyses were conducted for each condition. Indices of intergroup discrimination were constructed by subtracting outgroup ratings from ingroup ratings. As may be seen in Table 4, there was a positive correlation between intergroup discrimination and collective identity in the condition where intergroup relations were emphasized, r = .35, p < .05, but not in the non-emphasized condition, r = .17, p = .16.
3. Study 2
3.1 Participants
Ninety-two women took part in this study. All were students attending the University of Otago.
3.2 Design
The core design of the study was between subjects. In one condition intergroup relations were emphasized (the emphasis condition). In the other condition intergroup relations were not emphasized (the non-emphasis condition). All participants then evaluated ingroup (i.e., New Zealanders) and outgroup members (i.e., Americans) and completed a measure of collective identity.
Pilot test 1: To ensure that that the group emphasis manipulation that was to be used in study 2 worked, we conducted an independent pilot test. As in the pilot test for study 1 we (following the procedure detailed in the method and procedure section below) examined the extent to which social identity salience and depersonalization differed in circumstances that emphasized and did not emphasize the intergroup context. Participants (N = 94) were asked two questions. The first assessed identity salience (i.e., ’I identify with the other members of my group’). The second assessed depersonalization (i.e., ‘I am like the other members of my group’). Responses were recorded on 7-point Likert scales (1-strongly disagree, 7-agree strongly). Cell means are reported in Table one. Between subjects ANOVA’s revealed that amongst participants in the group emphasis condition social identity was more salient (M = 5.77, SD = .98 vs. M = 4.72, SD = 1.21), F(1, 92) = 21.01, p < .001, η2 =.19, and depersonalization was greater (M = 4.30, SD = 1.04 vs. M = 3.53, SD = 1.47), F(1, 92) = 8.43, p < .001, η2 = .19. These findings suggest that the group emphasis manipulation functioned to make intergroup behaviour more likely in the group emphasis condition.
Pilot test 2: To show that taking points away from ingroup and outgroup members represented a more negative form of discrimination than rating ingroup and outgroup members a second independent pilot test was conducted. Participants (N = 20) were presented with the trait rating tasks used in study 1 and the 6, 13-choice, distribution matrices to be used in study 2. Participants were then asked to rate each on 9-point Likert scales (9-very much to 1-very little). Repeated measures analyses of variance (ANOVA’s) revealed that the allocation task (which required points to be taken away from ingroup and outgroup members) was judged more likely to cause personal distress (M = 6.20, SD = 1.19, vs. M = 4.20, SD = 1.67), F(1, 19) = 12.25, p < .001, η2 =.39, be less pleasant (M = 6.80, SD = 2.10, vs. M = 3.30, SD = 1.80), F(1, 19) = 29.60, p < .001, η2 =.61, elicit more negative affect (M = 7.10, SD = 1.44, vs. M = 5.40, SD = 2.39), F(1, 19) = 8.84, p < .009, η2 =.32 and have more adverse effects (M = 6.00, SD = .97, vs. M = 4.85, SD = 1.66), F(1, 19) = 8.58, p < .008, η2 =.31.
Method and Procedure: Part of the procedure used in Study 1 (and study three) to emphasize intergroup relations drew attention to future interactions with outgroup members. One potential consequence of this manipulation is that the anticipation of intergroup interaction may have induced intergroup threat and thus contributed to the emergence of a link between collective identity and intergroup discrimination [42]. To control for this possibility in Studies 2 and 4 adopted an alternative means by which to differentially emphasize intergroup relations. In doing this, we amalgamated a number of the social identity manipulation procedures outlined by Haslam [43]. Thus, in the group emphasis condition, participants were presented with two tasks designed to draw attention to group membership. The first comprised a set of instructions adapted from Haslam [43], which read “People belong to all sorts of groups (i.e., national, religious and gender groups). These groups differ from each other. People belonging to such groups can also compare themselves with each other (e.g., New Zealanders vs. Americans). In the present study we are particularly concerned with national groups (i.e., those specifically comprised of New Zealanders and Americans). As you read the questions that follow please bear this in mind.” The second task required participants to list 3 things about New Zealanders and 3 things about Americans.
In condition 2 (where intergroup relations were not emphasized), participants were given the same instructions and followed the same procedure as those in the intergroup emphasis condition except that the initial tasks were designed to draw attention to the self at the personal level. Thus, the first task comprised a set of instructions which read “People differ from each other in all different kinds of ways. Each and every person is a unique individual. One person likes music, another likes to go for a walk. In the present study we are particularly concerned with how you differ from other people. As you read the questions that follow, please bear this in mind.” The second task required participants to list 3 things about themselves and 3 things about their best friend.
Intergroup discrimination was assessed by means of 6, 13-choice, distribution matrices. Using these matrices all participants was given the opportunity to take away different amounts of points from ingroup (i.e. New Zealanders) and outgroup members (i.e. Americans). The joint pay-off was constant through each column. Each matrix allowed participants to take away more from the ingroup, more from the outgroup or equal amounts from each. Participants were asked to imagine that the numerical values normally depicted in these matrices represented points in an international sports game (e.g. basketball, netball, softball).
Immediately after the discrimination tasks, participants completed the same measure of collective identity as utilized in Study 1 (e.g., ‘I feel good about being a New Zealander’, Cronbach’s alpha = .71). Higher scores reflect more positive levels of collective identity. Responses were recorded on a 7-point Likert scale (1-agree strongly, 7-disagree strongly). Participants were required to respond on the basis of their feelings in the immediate context.
3.3 Results
Intergroup Discrimination: A priori analyses indicated no gender differences, so these are not reported. Intergroup discrimination was assessed using a 2 (condition: group emphasis vs. no emphasis) x 2 (target group: ingroup vs. outgroup) mixed model ANOVA. The first variable was between samples. The second variable was within samples. Cell means are presented in Table 2. A main effect was found for target group F(1, 90) = 83.01, p < .001, η2 = .48. More points were taken away from the outgroup than the ingroup (M = 149.85, SD = 16.05 vs. M = 122.15, SD = 15.81). This effect was qualified by the interaction found between condition and target group, F(1, 90) = 16.94, p < .001, η2 = .16. Planned comparisons using repeated measures t-tests revealed that participants in the group emphasis t(45) = 8.35, p < .001, and non emphasis condition revealed, t(45) = 4.09, p < .001.
Collective identity: A between samples ANOVA compared the collective identity levels of those in the emphasized and the nonemphasized conditions. As may be seen in Table 3, collective identity was higher in the emphasized condition, F(1, 90) = 5.59, p < .02, η2 = .06.
Collective identity and Intergroup Discrimination: The association between collective identity and intergroup discrimination was assessed using correlation. Separate analyses were conducted for each condition. Indices of intergroup discrimination were constructed by subtracting the amount of points taken away from ingroup members from that taken away from outgroup members. As may be seen in Table 4, there was a positive correlation between intergroup discrimination and collective identity in the condition where intergroup relations were emphasized, r = .37, p < .05, but not in the non-emphasized condition, r = -.03, p = .83.
4. Study 3
4.1 Participants
Seventy-six people (16 men and 60 women took part in this study. All were students attending the University of Otago.
4.2 Design
The core design of the study was between subjects. In one condition intergroup relations were emphasized (the emphasis condition). In the other condition intergroup relations were not emphasized (the non-emphasis condition). All participants then evaluated ingroup (i.e., New Zealanders) and outgroup members (i.e., Americans) and completed a measure of collective identity.
Pilot test: To show that the allocation of white noise to ingroup and outgroup members represented a more negative form of discrimination than taking points away from ingroup and outgroup members an independent pilot test was conducted. Participants (N = 38) were then asked a series of questions about the matrix tasks (11- very much to 1-very little). Compared to the point deduction task, within subjects ANOVA’s revealed that, the white noise allocation tasks were judged to cause more personal distress (M = 9.21, SD = 2.19, vs. M = 7.61, SD = 1.80), F(1, 37) = 13.77, p < .001, η2 = .27, be less pleasant (M = 9.47, SD = 1.60, vs. M = 8.15, SD = 1.50), F(1, 37) = 29.39, p < .001, η2 = .42, elicit more negative affect (M = 9.63, SD = 1.67, vs. M = 7.73, SD = 1.42), F(1, 37) = 38, p < .001, η2 = ..51, and have more adverse effects (M = 8.22, SD = 2.12, vs. M = 6.98, SD = 1.86), F(1, 37) = 19.78, p < .001, η2 = .35.
Method and procedure: This study used the same method and procedure as used in Study 1, with the following exceptions. First, intergroup discrimination was assessed via 12, 13-choice, distribution matrices. The numerical values typically used to denote ‘points’ in each set of matrices were substituted to represent times (in seconds) that were to be spent listening to white noise. Using these matrices all participants was given the opportunity to allocate different amounts of white noise to ingroup (i.e. New Zealanders) and outgroup members (i.e. Americans). After the A, B and C type matrices outlined by Bourhis, Sachdev and Gagnon, [44] these matrices assessed the pulls of MD on MJP + MIP (e.g., maximum difference on maximum joint profit and maximum in group profit), FAV on MJP (e.g., ingroup favoritism on maximum joint profit), F on FAV (e.g., fairness on favoritism) and their inverse. Two pairs of each type of matrices were presented. To ensure that all participants were familiar with the sound in question a 10 second sample blast was administered to all participants. Following other researchers [7,39], we used the difference in the total amount (i.e., of white noise) allocated to ingroup and out-group members to assess intergroup discrimination.
Second, following the completion of the same 4-tem collective identity scale used in Study 1 (‘I feel good about being a New Zealander, Cronbach’s alpha = .78) two manipulation check items were incorporated. Following SCT [35,43], and the first question assessed identity salience (i.e., ‘I identify with the other members of the New Zealand group’), the second assessed depersonalization (i.e., ‘I am like the other members of the New Zealand group’). Responses were recorded on 7-point Likert scales (1-strongly disagree, 7-agree strongly).
4.3 Results
Intergroup Discrimination: A priori analyses indicated no gender differences, so these are not reported. Intergroup discrimination was assessed using a 2 (condition: group emphasis vs. no emphasis) x 2 (target group: ingroup vs. outgroup) mixed model ANOVA. The first variable was between samples. The second variable was within samples. Cell means are presented in Table 2. A main effect was found for target group F(1, 74) = 39.70, p < .001, η2 = .35. More white noise was allocated to outgroup than ingroup members (M = 166.88, SD = 26.37 vs. M = 140.61, SD = 30.60).
This effect was qualified by the interaction found between condition and target group, F(1, 74) = 9.73, p < .006, η2 = .11. Planned comparisons using repeated measures t-tests revealed that participants in the group emphasis t(37) = 5.64, p < .001, and non emphasis condition revealed, t(37) = 2.83, p < .008.
Collective identity: A between samples ANOVA compared the collective identity levels of those in the emphasized and the nonemphasized conditions. As may be seen in Table 3, collective identity was higher in the emphasized condition, F(1, 74) = 4.77, p < .02, η2 = .60.
Collective identity and Intergroup Discrimination: The association between collective identity and intergroup discrimination was assessed using correlation. Separate analyses were conducted for each condition. Indices of intergroup discrimination were constructed by subtracting the amount of white noise allocated to the ingroup from that allocated to the outgrou. As may be seen in Table 4, there was a positive correlation between intergroup discrimination and collective identity in the condition where intergroup relations were emphasized, r = .33, p < .03, but not in the non-emphasized condition, r = -.09, p = .48.
5. Study 4
5.1 Participants
One-hundred and twenty-two people (30 men and 92 women) took part in this study. All were students attending the University of Otago.
5.2 Design
The core design of the study was between subjects. In one condition intergroup relations were emphasized (the emphasis condition). In the other condition intergroup relations were not emphasized (the non-emphasis condition). All participants then evaluated ingroup (i.e., New Zealanders) and outgroup members (i.e., Americans) and completed a measure of collective identity.
Method and procedure: This study used the same method and procedure as used in Study 2, with the following exceptions. First, intergroup discrimination was assessed via a task that required the allocation of 100-seconds of white noise. Here participants were instructed that it was their job to distribute 100-seconds of white noise (listening time) to New Zealanders and Americans. It was emphasized that as much or as little could be allocated to each group - as long as total amount allocated was 100-seconds - and that group members (in a later experiment) would be required to listen for the time periods specified. The latter was included on the basis of a comment made by a participant who suggested that it was okay to allocate more white noise to outgroup members because they wouldn’t really have to listen to it. As in Study 3, all participants listened to a 10 second sample blast to ensure that all were familiar with the sound in question. Following other researchers [7,45], we used the difference in the total amount (i.e., of white noise) allocated to in-group and out-group members to assess intergroup discrimination.
Second, following the completion of the same 4-tem collective identity scale used in Study 1 (‘I feel good about being a New Zealander, Cronbach’s alpha = .71) two manipulation check items were incorporated. Following SCT [35,43], and the first question assessed identity salience (i.e., ‘I identify with the other members of the New Zealand group’), the second assessed depersonalization (i.e., ‘I am like the other members of the New Zealand group’). Responses were recorded on 7-point Likert scales (1-strongly disagree, 7-agree strongly).
5.3 Results
Intergroup Discrimination: A priori analyses indicated no gender differences, so these are not reported. Because the data obtained using the 100 second white noise allocation task violates the assumptions underlying analysis of variance (ANOVA,) we transformed our data using the Arcsine method. Untransformed cell means are presented in Table 2. Intergroup discrimination was assessed using a 2 (condition: group emphasis vs. no emphasis) x 2 (target group: ingroup vs. outgroup) mixed model ANOVA. The first variable was between samples. The second variable was within samples. Cell means are presented in Table 2. A main effect was found for target group F(1, 120) = 26.42, p < .001, η2 = .18. More white noise was allocated to outgroup than ingroup members (M = 56.14, SD = 13.59 vs. M = 43.86, SD = 13.59). This effect was qualified by the interaction found between condition and target group, F(1, 74) =6.77, p < .01, η2 = .05. Planned comparisons using repeated measures t-tests revealed that participants in the group emphasis t(60) = 4.54, p < .001, and non emphasis condition revealed, t(60) = 2.44, p < .02.
Collective identity: A between samples ANOVA compared the collective identity levels of those in the emphasized and the nonemphasized conditions. As may be seen in Table 3, collective identity was higher in the emphasized condition, F(1, 120) = 5.35, p < .02, η2 = 04.
Collective identity and Intergroup Discrimination: The association between collective identity and intergroup discrimination was assessed using correlation. Separate analyses were conducted for each condition. Indices of intergroup discrimination were constructed by subtracting the amount of white noise allocated to the ingroup from that allocated to the outgrou. As may be seen in Table 4, there was a positive correlation between intergroup discrimination and collective identity in the condition where intergroup relations were emphasized, r = .31, p < .009, but not in the non-emphasized condition, r = .12, p = .17.
6. Discussion
In Studies 1 through 4 a single hypothesis was tested. This hypothesis, derived from SCT [31,35], was that a positive relationship between collective identity and intergroup discrimination would emerge in circumstances that specifically emphasize the intergroup context. Support for this hypothesis was found in each Study. In conditions where intergroup relations were specifically emphasized, significantly positive associations were found between collective identity and intergroup discrimination (average r = .34). In conditions where intergroup relations were not emphasized, the relations between collective identity and intergroup differentiation failed to reach significance (average r = .04, the Fishers r to z transformation revealed that these correlations were significantly different, z (226) = 3.32, p < .0005).
Relations between intergroup discrimination held across increasingly noxious forms of discrimination (i.e., trait ratings, the removal of positive resources and the allocation of negative resources). Thus, in circumstances where intergroup relations were emphasized collective identity was associated with discrimination amongst New Zealanders’ who (a) rated New Zealanders more positively than Americans, (b) took more points away from Americans than New Zealanders, and (c) who allocated more white noise to Americans than New Zealanders. In circumstances where intergroup relations were not emphasized there was no relationship between New Zealanders levels of intergroup discrimination (whatever the form) and collective identity.
Pilot testing, manipulation checks and other analyses found increased levels of identity salience, depersonalization, collective identity and intergroup discrimination in each condition where the intergroup context was emphasized. These findings are consistent with the general thrust of research and theory outlined by those who have hypothesized and shown that group based behaviours are more likely to emerge in circumstances where intergroup issues are important to those concerned [31,46].
Our results are also in keeping with the views outlined by those researchers who have argued that the link between collective identity and intergroup discrimination will not emerge in all circumstances (e.g.,[9,29]. In this, regard our findings demonstrate that in situations where the intergroup context is specifically emphasized, significant and consistently positive correlations between collective identity and intergroup discrimination are possible. However, in situations where intergroup relations are not emphasized, as Turner [18], points out, the correlations between collective identity and discrimination are ‘modified’ so that no discernible relationship between these two variables emerge.
Overall the results of the present investigation help clarify much of the contradictory research in this area by illuminating the circumstances under which we are both more and less likely to find positive relations between intergroup discrimination and collective identity. Our findings additionally demonstrate that these relations hold when the forms of intergroup discrimination displayed become increasingly negative (i.e., when positive resources are taken away and when noxious stimuli are allocated). This, we believe is an important point. Intergroup discrimination outside the context of the laboratory often involves noxious outcomes. For this reason, if a particular social psychological construct (and the perspective from which it emanates) can account for the expression of mild in-group preferences, in-group love, or positive forms of discrimination [2,47,48], its use in helping us understand real instances of intergroup hostility is severely limited.
Whilst our findings suggest that when the intergroup context is emphasized distinct forms of intergroup discrimination are associated with collective identity we should remain cautious about their generalisability. First, collective identity is multidimensional [33,49] and not all dimensions have been found to be equally associated with intergroup discrimination [9,10,33]. As such, altough our findings hold with respect to the (evaluative) dimension of collective identity utilized in each of the present studies, we would not necessarily expect them to hold with respect to other dimensions of collective identity (e.g., the cognitive, affective).
Second, much of the previous work in this area has tended to measure collective identity prior to intergroup discrimination. In the current investigation collective identity was measured after intergroup discrimination. It is possible that intergroup discrimination is a better predictor of collective identity, than is collective identity of intergroup discrimination. Future research could address this neglected issue by measuring collective identity both before and after the display of intergroup discrimination.
Third, in each of the four studies carried out as part of this investigation New Zealanders served as the ingroup and Americans served as the outgroup. These groups differ hugely in terms of relative group size, power and status. New Zealanders forming the ‘David’ ingroup and Americans forming the hyper-powerful ‘Goliath’ outgroup. To the extent that it may be more socially acceptable to show discrimination against numerically powerful outgroups, it remains to be seen whether our findings are replicated amongst social category members who show intergroup discrimination against those belonging to smaller, less potent and threatening outgroups [50,51].
Regardless of the outcome of such eventualities a clear implication of our results is that context is crucially important when assessing the link between intergroup discrimination and collective identity. In circumstances that emphasize intergroup relations, intergroup discrimination and collective identity are likely to be related. In circumstances where there is no emphasis on intergroup relations, intergroup discrimination and collective identity are unlikely to be related. Overall these findings help clarify much of the contradictory research in this area by demonstrating the circumstances under which positive relations between intergroup discrimination and collective identity will emerge.
Competing Interests
The authors have declared that no competing interests exist.
Author Contributions
All the authors substantially contributed to the study conception and design as well as the acquisition and interpretation of the data and drafting the manuscript.