


1. Introduction
A Japanese survey that is performed every 5 years has indicated that the percentage of ≥65-year-old individuals who have intellectual disabilities (ID) has risen from 2.6% in 1995 to 9.3% in 2011 [1]. This result implies that the life expectancy of people with ID has been increasing in Japan. Furthermore, other studies have reported that the life expectancy of people with ID is increasing throughout the world [2-4], which highlights the importance of health promotion among this population.
Methods to prevent metabolic syndrome have recently focused on the prevention of lifestyle diseases, such as cardiovascular disease, cancer, chronic respiratory disease, and diabetes. These methods focus on preventing obesity by reducing visceral fat. In addition, the Japanese Ministry of Education, Culture, Sports, Science and Technology requires every insurance provider to provide health check-ups and guidance to help prevent metabolic syndrome. However, it may be difficult for handicapped people to use this healthcare system [5].
Despite the importance of health promotion, various studies have reported a higher prevalence of obesity among people with ID or developmental disabilities (e.g., autism spectrum disorders and Down syndrome) [6-9]. This may be due to genetic factors [10,11], psychopharmacological effects [12-14], and other risk factors for obesity (e.g., sleep problems, food selectivity, delayed/impaired motor development, and family functioning) [9]. However, methods to help prevent obesity among handicapped people remain unclear, as most studies have investigated the mechanisms of obesity in relation to health promotion among non-disables people. For examine, we have clarified the patterns in body mass index (BMI) trajectories among Japanese children without disabilities and discussed the timing of obesity onset during childhood [15]. In contrast, only a few studies have evaluated obesity among people with disabilities, and especially among people with ID and developmental disorders [8,16,17]. Thus, we do not currently have enough information to develop measures to prevent obesity among this vulnerable population. Therefore, the present study aimed to explore the patterns of BMI trajectories and obesity onset, as well as the prevalence of childhood obesity,amongJapanese children with ID (including Down syndrome).
2. Methods
This cohort study was performed at a special needs school for children with ID in Yamanashi prefecture, Japan. We included 231 students (6–18 years old) who were born between April 1994 and March 2006, and were receiving special needs education on April 1, 2012 (elementary school: 53 children, junior high school: 62 children, high school: 116 children). All students had ID, including Down syndrome, and there were 155 boys and 76 girls. We collected data regarding the children’s height and weight using measurements that were taken during their annual school health monitoring check-up. Data regarding a diagnosis of Down syndrome were obtained from their entrance applications, which were completed by their parents.
This study’s design was approved by the Ethical Review Board from the University of Yamanashi School of Medicine. Parents provided informed consent before using their children’s anonymized data regarding height and body weight, and were provided the opportunity to opt out of this study. All data were anonymized by the school nurse before being sent to the authors.
2.1 Study variables and analyses
The primary outcome was obesity or overweight status, which was determined via the Rohrer index and Japanese obesity index ([weight – standard body weight] / standard body weight × 100). This index was used because there is a standard weight for Japanese children that has been recommended by Japanese pediatricians.
2.2 Associations between obesity, sex, and Down syndrome
After categorizing the independent continuous variables, we evaluated their association with the primary outcome using the chi square test. The Mann-Whitney U test was used to examine the association between obesity and Down syndrome. The associations for categorical variables were quantified as odds ratios, and we also calculated the 95% confidence intervals and p-values for these associations.
2.3 BMI trajectory patterns
BMI trajectories were determined by fitting a semiparametric mixture model using the PROC TRAJ macro in SAS software (version 9.2; SAS Institute, Cary, NC) [18,19]. We fitted this model to the data for eight BMI measures among the children, who were grouped according to sex. This group-based modeling approach made it possible to identify a number of discrete classes, with each having a specific intercept and age-slope for the estimated population prevalence [20]. Based on recent studies [21], we assumed a cubic (third-order polynomial) trajectory shape, as this is the most flexible option in the PROC TRAJ macro. Estimation of the trajectories was performed using a censored normal model that is typically used to model the conditional distribution of censored variables when there is a cluster of data at the maximum or minimum values [21].
3. Results
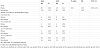
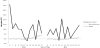
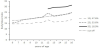
The distribution of obesity according to age is shown in Table 1. The greatest prevalences of obesity were 25.8% among boys with ID and 21.1% among girls with ID. The greatest prevalences of obesity were observed among 6–8-year-old boys and among 15–17-year-old girls. The average obesity index for each age was higher in the present study than the prefecture-specific and national obesity indexes, with the exceptions of boys who were 12 or 15 years old and girls who were 10 years old (Figure 1). The highest average obesity indexes were observed among 6-year-old boys and 12-year-old girls, although we observed a varied distribution according to age. Therefore, we explored the BMI trajectory patterns using the cohort’s data, and observed that the Bayesian information criterion score increased as more groups were added. Thus, based on our clinical knowledge and the objectives of the analyses, we selected a three-group model for the boys (Figure 2). However, no optimal model was selected for girls, because their data had too many missing values for our analyses. Group 1 (47.6%) was defined as children with stable and normal BMI scores. Group 2 (33.6%) was defined as children with a BMI that exceeded the overweight cut-off value at the age of 8 years. Group 3 (18.9%) was defined as children with a BMI that exceeded the overweight cut-off value at the age of 12 years. Groups 1 and 2 exhibited a convex shape change that appeared at the age of approximately 12 years.
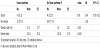
We did not observe any significant sex-related differences among the children with ID (Table 2). However, the mean values for the Japanese obesity and Rohrer indexes were significantly higher among children with Down syndrome, compared to children without Down syndrome (p < 0.001) (Figure 2). Children with Down syndrome exhibited a trend towards being more likely to be obese, compared to children without Down syndrome. The unadjusted odds ratio for obesity among children with Down syndromewas 2.49 (95% CI: 0.95–6.53, p = 0.06), compared to children without Down syndrome, although this result was not statistically significant.
4. Discussion
Our results revealed that the maximum prevalences of obesity among Japanese children with ID were 25.8% among 6–8-year-old boys and 21.1% among 15–17-year-old girls. These prevalences were 1.71-fold greater than the value for pre-pubescent boys (15.1%) and 1.88-fold greater than the value for girls in their late puberty (11.2%), which were reported for 2003–2004 in a Japanese study [22]. Thus, our findings indicate that children with ID have a greater prevalence of obesity, compared to their age-matched counterparts who do not have ID. In addition, there may be sex-related differences in the onset of obesity.
In Japan, parents of children with disabilities can select the school for their children to attend, due to the Comprehensive Support for Persons with Disabilities measure, which attempts to provide normalized care for all individuals. Unfortunately, this has led to numerous children changing schools to receive special needs education, which makes it impossible to collect longitudinal data over long periods. However, our results indicate that the onset of obesity predominant occurs at the ages of 8 years and 12 years among Japanese children with ID. These results are consistent with the results of a previous study, which reported that the optimal time to prevent obesity was pre-puberty for boys and late puberty for girls, due to the variable timing of body composition changes [23]. However, our analysis did not reveal any significant sex-related differences in the prevalences of obesity among children with ID. Therefore, our findings suggest that methods for preventing obesity during childhood may be the same for children who do and do not have disabilities. Furthermore, we did not observe a significance difference in the prevalence of obesity among children who did and did not have Down syndrome, although a significantly higher mean obesity index value was observed among children with Down syndrome. Therefore, our results may indicate that children with Down syndrome can easily develop serious obesity, and further studies are needed to examine this issue in a larger sample size.
This study has two important limitations. First, we combined both sexes for our analyses, in order to increase the sample size and reduce the likelihood of type II error. Second, we used a cohort design, which prevented us from evaluating the adiposity rebound that is associated with later-onset obesity, and precludes any discussion regarding its effects on obesity among children with disabilities [24-26]. Nevertheless, to our best knowledge, the present study is the first to evaluate obesity among Japanese children with ID, and data regarding this population is urgently needed to develop optimal health promotion methods [27]. Therefore, future longitudinal studies should evaluate these children from infancy, in order to clarify any similarities or differences regarding the mechanism of obesity in this population, and to establish strategies for health promotion during childhood.
5. Conclusions
The present study demonstrated that the maximum prevalences of obesity among Japanese children with ID were 25.8% among 6–8-yearold boys and 21.1% among 15–17-year-old girls. This result indicates that children with ID have a higher prevalence of obesity, compared to the previously reported prevalences among children without ID. We also observed that obesity onset occurred predominantly at the ages of 8 years and 12 years, although we did not detect any significant sex-related differences in the prevalences of obesity among children with ID. Furthermore, there was no significant difference in the prevalence of obesity between children with and without Down syndrome. However, the mean obesity index among children with Down syndrome was significantly higher than the index among children without Down syndrome. This result suggests that children with Down syndrome may easily develop serious obesity. Therefore, future studies are needed to collect longitudinal data and to clarify any similarities or differences in the mechanism of obesity, which may help establish strategies for health promotion during childhood among this population.
Competing Interests
The author declares no conflict of interest in this study.
Author Contributions
CH designed the study, conducted the statistical analysis, and created the early versions of the manuscript. MA supported CH in data analysis and drafted the manuscript.
Acknowledgments
The authors thank the staff of the Special Needs School in Yamanashi prefecture for their cooperation.