


1. Introduction
The photovoltaic market sees a potential for cost reduction in the usage of alternative silicon feedstock. For example, less expensive substrates of upgraded metallurgical silicon are used as mechanical supports for epitaxial solar cells [1]. This type of feedstock has a higher concentration of impurities, which can decrease the mechanical strength of the wafers [2], [3]. To achieve high yield in solar cell production, it is important to quantify the effect of these impurities on the mechanical behaviour of multicrystalline silicon. Impurities that are deleterious to the mechanical strength of silicon wafers must be avoided.
Cracks are the most harmful type of defect because stresses intensify at the tip of cracks. In addition to microcracks, inclusions can also be fracture initiators [4] because of the thermal residual stresses introduced during processing and the intensification of stress that occurs when an external load is applied in the surroundings of inclusions. Moreover, the same impurity inclusions change the elastic modulus of silicon and the stress intensity factor of a crack approaching the inclusion. Hence, the quantification of the effect of inclusions on silicon fracture is of great importance for strength interpretation and failure prediction.
The effect of different types of impurities on the mechanical behaviour of multicrystalline silicon for photovoltaic applications is studied in this work. These impurities are metals, silicon oxide and silicon carbide. Bending tests, fracture toughness and elastic modulus measurements were performed to provide accurate quantification of the effect of these impurities on the mechanical and fracture behaviour of silicon. The experimental results were compared with models of the mechanical behaviour of ceramics available in early literature to achieve relevant failure prediction.
2. Materials and Methods
The silicon samples tested in the present work were provided from a multicrystalline silicon block crystallised using the vertical gradient freeze method [5]. The concentration of impurities in the silicon feedstock was measured using inductively coupled plasma optical emission spectrometry (ICP-OES). The content of different impurities within the silicon feedstock is summarised in Table 1.
2.1 Strength measurement
Silicon wafers of approximately 260 μm thickness were cut using a multi-wire slurry saw. Wafers from three different positions within the block were collected and etched to remove any subsurface damage, which lowers the mechanical strength of silicon wafers [6]. That is, a silicon layer 12-15 μm thick was removed on each side of the wafers. The etched multicrystalline silicon wafers were diced with a laser into round chips with 22 mm diameters. These chips were analysed using the ring-on-ring bending test following the specifications in the literature [7]. The diameters of the supporting and loading rings were 18 mm and 6 mm, respectively. The maximum principle stresses at which the wafers broke in the ring-on-ring bending test were calculated from the measured force-displacement curves using the finite element programme Ansys.
Additionally, silicon samples of 2 mm thickness were cut using a multi-wire saw. Samples from six different positions within the block were collected, shaped to a sample width of 10 mm and strongly etched to remove any subsurface damage and smooth edges and corners. These samples were broken in three-point bending tests. The span between the supporting rods was 20 mm. The maximum deflection during bending was much smaller than the thickness of the samples. Thus, the fracture stresses were calculated using the equations of the linear elastic fracture theory [8].
Finally, a two-parameter Weibull distribution was fitted to the values of fracture stresses, which were measured using either the ringon- ring or three-point bending test, using the maximum likelihood method described in the literature [9].
2.2 Fracture toughness measurement
Bending tests of precracked specimens is a common procedure to measure the toughness of ceramics. Samples of 2 mm thickness were prepared to measure the toughness of the same multicrystalline silicon samples that were broken using the three-point bending test. Thus, the fracture toughness was measured at six positions within the silicon block. A notch was introduced on one side of the samples using a steel diamond wire of 130 μm diameter. The length of the notches was measured at five different positions, and the average value was considered as the notch length. The samples were broken using a three-point bending test, where the notch in the sample was carefully aligned with the central loading rod. The span between the supporting rods was 10 mm. Guinea et al. [10] proposed a simple and general expression for calculating stress intensity factors from the values of maximum load and length of the notches for this type of tests.
2.2.1 Dynamic elastic modulus measurement
Elastic materials exhibit specific mechanical resonant frequencies that are determined by the elastic modulus, mass and geometry of the test specimens [11]-[12]. Thus, the macroscopic elastic modulus of the samples was measured prior to the bending tests. The mass and exact dimensions of the samples were measured. The samples rested on two anti-vibration supports, and the vibration of the sample was excited by exerting an impulse at the middle of the length of the beam.
The resonant frequency of the sample beam was measured using a piezoelectric sensor that was in contact with the sample and was recorded in the display of an oscilloscope connected to the sensor. Given the mass, dimensions and mechanical resonant frequency of the samples, their elastic modulus was calculated.
3. Theory
3.1 Mechanical strength
Silicon is brittle at room temperature and therefore exhibits linear elastic mechanical behaviour typical of ceramics. The mechanical strength of ceramics is sensitive to defects. The most detrimental types of defect are microcracks, where stresses intensify at the tip of the cracks. The well-known expression for the stress intensity factor of a crack loaded under mode I is [4], [13]:
where Y is a geometric factor that depends on the geometry of the crack and the loading configuration, σ is the stress at the tip of the crack and a is the crack length. When this parameter reaches a critical value, called the “critical stress intensity factor” or “fracture toughness”, the crack propagates in the material. This fracture criterion can be formulated in terms of energy for plane stress [13]:
where Gc is the critical energy release rate, which is the derivate of the elastic energy with respect to the area of the crack. Gc is also called the specific fracture energy.
Pores or voids and inclusions are the second and third most important causes of fracture, respectively. Directionally solidified silicon does not contain a significant number of pores within the silicon matrix. Thus, impurity inclusions remain the most relevant type of defect influencing the mechanical strength of multicrystalline silicon wafers after the microcracks introduced during the multi-wire sawing of the silicon wafers.
3.1.1 Thermal mismatch
3.1.1.1 Thermal residual stress
Residual thermal stress is a type of stress that remains in the silicon matrix after the crystallisation process. These stresses build up during the cooling of the multicrystalline silicon blocks due to the difference in the thermal expansion coefficients between the silicon matrix and the impurity inclusions. Thermal stresses build around spherical impurity inclusions in radial and tangential directions and are their values are given by [14]- [15]:
where αsi,i, υsi,i and Esi,i and are the expansion coefficients, Poisson's ratio and elastic modulus for silicon and the inclusion, respectively. P is the stress inside the inclusion, and Tf is the ductile-brittle transition temperature in silicon (~750°C) [16]. Above Tf , silicon can accommodate stresses by the creation and movement of dislocations in the silicon matrix. However, below , the silicon matrix cannot relax thermal stresses, and residual stresses build up in the silicon matrix. T is the ambient temperature, R is the inclusion radius and r is the distance from the centre of the inclusion. If the thermal expansion coefficient of the impurity inclusion is lower than that of silicon, the tangential thermal stresses, σ00, are tensile, and radial microcracking can occur. However, when the thermal expansion coefficient of the impurity inclusion is higher than that of silicon, the radial thermal stresses, σrr, are tensile, and circumferential microcracking can occur [13].
3.1.1.2 Spontaneous micro-cracking
Early experiments observed that microcracking after cooling occurs only in the surroundings of inclusions larger than a critical inclusion size. Davidge et al. [17] proposed a criterion for circumferential microcracking based on the existence of a flaw near the inclusion interface. The elastic stored energy in the inclusion and the surrounding silicon matrix supply the energy necessary for the interfacial flaw to grow. The total stored elastic energy must equal or exceed the energy necessary to create a new fracture surface. The critical inclusion radius for circumferential microcracking can be calculated as follows [17]:
where γsi is the fracture surface energy of silicon.
Ito et al. [18] proposed another model for evaluating circumferential microcracking. The model is based on the calculation of the strain energy release rate as a function of the inclusion size and the size of a flaw at the inclusion´s interface. Microcracking occurs when the strain energy release rate reaches a critical value at small interfacial flaws:
where K1c is the fracture toughness, α is the pre-existing flaw size and μ = α/R.
Evans et al. [19] proposed spontaneous microcracking criteria based on the approximation of stress intensity factors at pre-existing defects at or near the interface between a circular inclusion and the silicon matrix. If the stress intensity factor exceeds the value of fracture toughness, K1c, for the matrix at pre-existing flaws, cracks will propagate. The criterion for spontaneous circumferential and radial microcracking is given, respectively, for an interfacial flaw length of 0.2R by equations (8) and (9).
For radial spontaneous microcracking, Green [20] proposed a cracking criterion for spherical inclusions with an annular initial flaw. The criterion is based on the calculation of the stress intensity factor of an annular flaw at the equator of the inclusion. The critical inclusion radius for spontaneous radial microcracking is in this case:
3.1.2 Elastic mismatch
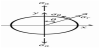
Stress intensification can occur in the surroundings of an inclusion when an external load is applied. The difference in elastic constants between silicon and the impurity inclusion is responsible for the disturbance of an applied stress field, σα. This elastic stress depends on the angle of orientation, θ, with the applied load (Figure 1).
Goodier [21] derived expressions for calculating the stress distribution in the vicinity of a circular inclusion:
The terms A and B depend on the elastic constants of the silicon matrix and of the impurity inclusion [21]. Inclusions with smaller elastic constants than silicon experience maximum tangential stresses at an orientation of 90° from the applied load. However, inclusions with larger elastic constants than silicon sense maximum radial stresses at an orientation of 0° from the applied load.
3.2 Fracture toughness
The fracture toughness of a ceramic can be influenced by second phase inclusions. Several mechanisms exist for explaining the change in fracture toughness due to inclusions. For the purpose of this work, we will focus on the change in the fracture energy and stress intensity factor of a crack approaching an inclusion. Stress intensity factors at the crack tips can be influenced by the localised residual stresses and elastic properties of the inclusions. Khaund et al. [22] analysed the change in the stress intensity factor of a crack approaching a circular inclusion because of thermal mismatch. Tangential thermal stresses are tensile for inclusions with smaller thermal expansion coefficients than silicon. Therefore, the stress intensity factor that a crack tip experiences when the crack is approaching the inclusion is increased, and the crack is accelerated towards the inclusion. Thus, the toughness of the bulk silicon decreases [22]. Inclusions with larger thermal expansion coefficients than silicon, and thus with compressive tangential residual thermal stress in their surroundings, decrease the local stress intensity factor at the crack tip. The approaching crack is then decelerated, and the toughness of the bulk silicon bulk increases.
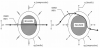
Li et al. [23] simulated the variation of the energy release rate at the tip of a crack that approaches and penetrates an elastic and circular inclusion due to a uniaxial stress field. For a stiff inclusion (Ei>ESi), the crack is shielded as it approaches the inclusion, and the crack front is decelerated. A soft inclusion (Ei<ESi) amplifies the energy release rate when it approaches the inclusion, and the crack is thus accelerated.
The crack path can therefore be repelled or attracted by the inclusions. If the inclusion has a smaller thermal expansion and a smaller elastic modulus than the silicon bulk, the crack is attracted to and propagates through the inclusion (Figure 2, left image), and the toughness of the silicon decreases. If the inclusion has a larger thermal expansion coefficient and elastic modulus, the crack is first deflected out of the plane as it approaches the inclusion and continues its propagation at the inclusion interface (Figure 2, right image) [24]. The toughness of silicon in this case increases.
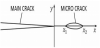
In the case that spontaneous micro-cracking in the vicinity of the inclusions occurs, the toughness of silicon can be diminished. Rose [25] proposed an estimation of fracture toughness degradation due to collinear microcracks linking up with an advancing main crack (see Figure 3).
3.3 Elastic modulus
Silicon is an anisotropic crystal; therefore, its elastic constants depend on the crystal orientation. Because the calculations in this work are based on the assumptions that the material is continuous, homogeneous, and isotropic, a quasi-isotropic approximation of the elastic modulus for multicrystalline silicon is needed as the reference value for our silicon wafers. The elastic modulus can be averaged using the Voigt average method, EV, over the stiffness, c11, c12, c44 [26], and using the Reuss average method, ER, over the compliances, s11, s12, s44 [16]. The Voigt and Reuss moduli are the upper and lower bounds of the elastic modulus, and thus, the average value of the previous parameters is a good estimate of the quasi-isotropic elastic modulus of silicon [4].
It is also observed in the literature that the elastic modulus of ceramics depends on the elastic properties and volume fraction of inclusions. Increasing fraction volumes of stiffer inclusions increase the elastic modulus of the ceramic. In the same manner, increasing volume fractions of softer inclusions, or pores and cracks, decrease the elastic modulus of the ceramic. Hashin and Shtrikman [27] determined the bounds for the elastic modulus of a ceramic that contains second phase inclusions.
Special attention should be drawn to the decrease in elastic modulus when spontaneous microcracking of the silicon matrix occurs after the crystallisation process. Budiansky and O’Connell [28] proposed a model for predicting the elastic constants of an isotropic and homogeneous solid with randomly distributed cracks. According to this model, the decrease in elastic modulus depends on a crack density parameter.
3.4 Failure criteria
For inclusions with high thermal expansion coefficients, αi>>αSi, circumferential microcracking can be present in the silicon matrix after the crystallisation process due to high thermal stress. These microcracks form a semi-sphere and represent the dominant type of defect limiting the strength of the specimen. These microcracks are equivalent to sharp “penny” cracks [19]. The failure criterion for a micro-crack is:
In the case that spontaneous microcracking of the silicon matrix does not occur after directional solidification, cracks can develop in the surroundings of the inclusions at loads below the fracture stress. Fracture at inclusions occurs under the combination of residual thermal stresses and applied stresses.
A conservative failure criterion for fracture at inclusions consists of equalling the inclusion size (2R) to the critical crack length in the Griffith expression [19]. The stress acting on an inclusion-sized crack is considered to be the addition of the applied intensified load and thermal residual stress.
where σT is the residual thermal stress and σM is the intensified applied mechanical load.
Evans [19] proposed expressions for the stress intensity factors of initial flaws in the vicinity of circular inclusions due to thermal and elastic mismatch. The failure prediction is in this case:
where KT is the stress intensity factor that a small interfacial flaw experiences due to the thermal residual stress, and KM is the stress intensity factor due to the applied mechanical load.
For inclusions with smaller and larger thermal expansion coefficients than silicon, the thermal stress intensity factors at the inclusion interface are, respectively [19]:
where α is the length of an initial flaw located at the inclusion interface.
For inclusions with a smaller elastic modulus than silicon, the maximum mechanical tangential stress intensity factor at an orientation of 90° from the applied uniaxial load is [19]:
These expressions for the stress intensity factor are only valid for flaw sizes α ≲ 0.2R.
Green [20] suggested several expressions to predict the critical inclusion size for radial and circumferential microcracking due to an applied stress in the vicinity of a spherical inclusion with a residual stress field in its surroundings. It is assumed that the matrix and the inclusion have the same elastic properties. Therefore, Green´s analysis is only valid for systems where the residual thermal stresses are larger than the stresses due to elastic mismatch.
For inclusions where αi>αSi, the critical inclusion size for circumferential microcracking is:
In the case of inclusions with αi<αSi initial flaws of length a which are perpendicular to the interface are most deleterious. In this case, the stress-induced critical inclusion radius is:
4. Results
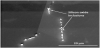
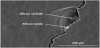
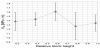
The mechanical strength at the bottom of the multicrystalline silicon block measured using the ring-on-ring bending test was considerably smaller than the mechanical strength of the upper parts of the block (Figure 8). The scanning electron microscope, SEM, images taken at this block height revealed a relatively high density of SiOx inclusions. It was possible to distinguish two types of inclusions using a scanning electron microscope. On the one hand, spherical and amorphous SiOx inclusions [29] of approximately 1-2 μm size precipitated at grain boundaries (Figure 4). On the other hand, larger amorphous and dendritic precipitates [30] were observed in the silicon bulk (Figure 5). Energy-dispersive X-ray spectroscopy, EDX, analysis revealed the presence of copper together with the silicon oxide inclusions, which suggests the possibility that copper enhanced the precipitation of silicon oxide [31]. It was not possible to measure the mechanical strength at this block position using the three-point bending test.

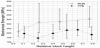
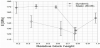
However, relatively low mechanical strength was also measured at 25% of the relative ingot height. The fracture toughness values measured at this block height (Figure 9) were low in comparison with the fracture toughness values of other parts of the block, which could be the cause of the low mechanical strength.
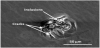
Silicon carbide inclusions were also observed with increasing density in the upper parts of the block (Figure 6). The measured values of dynamic elastic modulus (Figure 10) stayed beyond the quasi-isotropic value of the elastic modulus of silicon (162.6 MPa) and were relatively constant throughout the entire block height except for the very top part of the block. The static values of elastic modulus measured using the ring-on-ring bending test were lower than the dynamic values due to the measuring technique used, and therefore, the dynamic elastic modulus is the best estimate for the elastic modulus of multicrystalline silicon. However, the static values also indicate that the elastic modulus is constant throughout the block height. A low density of inclusions with moderate microcracking in their surroundings (Figure 7) was observed at the top part of the silicon block. EDX analysis revealed the presence of oxygen, carbon and metals at these inclusions. Thus, microcracking is interpreted to occur as metals segregate to silicon carbide or silicon oxide inclusions, where they can getter.
5. Discussions
The experimental results are contrasted in this section with the theoretical models for the mechanical behaviour of ceramics to evaluate the causes of breakage and to predict the fracture stresses of silicon containing different impurity inclusions. Table 2 summarises the material parameters used for the calculation of thermal residual stresses: the critical inclusion radius, elastic stresses, change in local toughness, elastic modulus and fracture criteria.
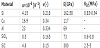
The values of the thermal expansion coefficients of silicon and silicon carbide are temperature dependent [32], [33]. Thus, the values for these materials in Table 2 were determined at 775°C, which is the brittle-ductile temperature of silicon considered in this work [16]. The elastic modulus and Poisson´s ration of silicon carbide at 775°C were published by Sakaguchi et al. [34]. The remainder of the properties were acquired from [35]. Sinclair and Lawn [36] estimated the surface energies of different crack planes for diamond structure crystals. For silicon, the surface energies of the {111} and {110} planes are 1.41 J⁄m2 and 1.74 J⁄m2 , respectively. Therefore, the mean value of 1.6 J⁄m2 was used for the calculations in this work.
5.1 Metals
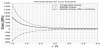
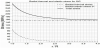
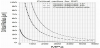
The results in the previous section indicate a decrease in all the mechanical properties at the upper part of the multicrystalline silicon block, where the metal impurities can segregate. The thermal mismatch between the metals and silicon is critical due to the large difference in their thermal expansion coefficients (Table 2). Aluminium can build thermal stresses in the radial direction up to 1600 MPa and copper up to 1500 MPa at the inclusion´s interface (Figure 11 and Figure 12).
These large residual thermal stresses reveal that the critical inclusion size for circumferential microcracking for metals is small. The model of Davidge equation (6) presents a conservative estimate for critical inclusion size. For metals within the silicon matrix, this value is smaller than 1 μm (Table 3). According to Ito et al. (equation 7), the minimum critical inclusion size is also smaller than 1 μm for metallic inclusions with initial flaws at the spherical inclusion interface that extend 60-120°. According to Evans equation (8), if the impurity inclusion is considered to exhibit a circular form, the critical inclusion radius is approximately 1 μm if an initial flaw size length of 0.2R is assumed.
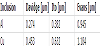
Figure 13 depicts the decrease in elastic modulus with increasing crack density in the silicon matrix. The value of elastic modulus without microcracking is considered to be ~172 GPa, which is the mean value of the elastic modulus measured at 65% of the relative block height before microcracking occurred at 79% of the relative block (Figure 10).
Given that the decrease in elastic modulus measured at 79% of the relative block height (Figure 10) was due to microcracking, the crack density in silicon can be determined using the graph of Figure 13. A value of elastic modulus of 167 GPa measured at 79% of the relative block height corresponds to a low crack density value of ~0.04. This decrease in the elastic modulus of silicon should manifest in a decrease of the fracture toughness from 1.57 MPa√m at 65% of the block height to 1.54 MPa√m at 79% of the block height according to Figure 14 if x1⁄x2 is estimated as 0.96 as the crack density in one space direction takes a value of ~0.04. However, the measured decrease in fracture toughness has a mean value of 1.33 MPa√m (Figure 9). There is a large inaccuracy in the prediction of the value of material toughness.
Moreover, the error bars of the elastic modulus and the fracture toughness are large, which indicates a considerable inhomogeneity of the microstructure of the material. The inaccuracy could occur because the real value of elasticity and fracture toughness of the material without microcracking at 65% of the relative block height are not known, and therefore, the values of elastic modulus and toughness of a lower position in the block are considered for the calculation. Another reason could be the lengths of the notches introduced for measuring fracture toughness. Figure 7 reveals microcracking of approximately 50 μm in length. The notches are much larger than the microcracking such that crack linking is more likely to occur due to the fracture toughness measurement than for ordinary fracture caused by much smaller surface defects, which would link the cracks within the silicon bulk at a much lower probability. It can be concluded from these observations that when microcracking occurs, it is convenient to introduce notches with a length similar to the extent of the microcracking in the samples for the fracture toughness measurement.
The fracture criterion when microcracking occurs around inclusions is defined by Equation 13. At 79% of the relative block height, the failure criterion for the three-point bending test is:
1.33=1.12×182√πa
where 1.33 is the measured fracture toughness of the material at 79% of the block height in MPa√m, 1.12 is the geometry factor for the three-point bending test, 182 is the calculated characteristic stress in MPa and α is the crack length. The crack length is thus ~14 μm, which is in good agreement with the crack lengths observed with the scanning electron microscope (Figure 7).
5.2 Silicon oxide
The presence of silicon oxide at the bottom of the silicon block was revealed by inspection of the samples with the scanning electron microscope (Figure 4 and Figure 5). The mechanical strength measured using the ring-on-ring bending test at 5% of the block height was significantly lower than the mechanical strength measured at the upper parts of the block. Fractography analysis revealed fracture patterns that followed the location of the silicon oxide inclusions at grain and twin boundaries. The low values of mechanical strength and toughness measured using the three-point bending test at 25% of the block height could also be caused by the precipitation of silicon oxide. However, it was not possible to reveal the presence of silicon oxide by fractography analysis of the samples broken by the threepoint bending test. The samples broken by the ring-on-ring bending test were glued to a plastic tape on the side of the samples under compression so the broken pieces could be analysed together in the microscope after fracture. This process facilitated the observation of silicon oxide within the fracture paths of the samples broken by the ring-on-ring bending test.
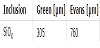
Tangential thermal stresses in the surroundings of silicon oxide inclusions are tensile and reach values beyond 100 MPa at the inclusion interface (Figure 15). If the inclusion is considered spherical with an annular initial flaw in its equator, the minimum critical inclusion radius that would cause spontaneous microcracking of the silicon matrix is 305 μm for an initial flaw length of ~0.3R (Table 4). If the silicon oxide inclusion is considered circular with an initial flaw size length of 0.2R and perpendicular to the inclusion interface, the critical inclusion radius is 760 μm. The observed inclusion sizes were smaller (Figure 4 and Figure 5) than these two hypothetical cases, and therefore, radial microcracking of the silicon matrix does not occur in the surroundings of amorphous silicon oxide.
When a load is applied in the surroundings of a silicon oxide inclusion, the stress field is disturbed by the presence of the inclusion, as it has lower elastic constants than silicon. When a uniaxial load of 150 MPa is applied, tangential stresses oriented between 55° and 125° from the applied load are intensified. The intensification of the tangential elastic stress reaches a maximum at 90° from the applied load, where the elastic stress reaches a value of ~240 MPa (Figure 15). Therefore, the maximum overlap of the tensile tangential thermal and elastic stresses occurs at an orientation of 90° from the applied load, as depicted in Figure 15. In the case that only 150 MPa is applied in the vicinities of the silicon oxide inclusion, the inclusion would experience 340 MPa at its interface due to the overlap of the tangential stresses.
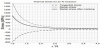
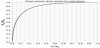
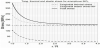
The intervals for the failure criterion near silicon oxide inclusions depending on the inclusion geometry are depicted in Figure 16. A conservative failure criterion can be used for fracture prediction if the overlap of thermal and elastic stresses is considered to act on an inclusion-sized crack when an external load is applied. This failure criterion, described by Equation (14), is depicted by the solid line in Figure 16. The dotted line presents the failure criterion according to Green and is described by Equation (20). This failure criterion considers that fracture is caused by radial crack extension when a load is applied in the surroundings of a spherical inclusion with an initial flaw size length of 0.2R. The dotted line represents the Evans fracture criterion when the silicon oxide inclusion is considered to be circular with an initial flaw size length of 0.2R. The appropriate expressions for the stress intensity factors proposed by Evans are introduced in Equation (15). The calculated characteristic stress at 25% of the block height, measured using the three-point bending test is considered here for further analysis. The calculated characteristic stress is 144.2 MPa. If the abscissas value for the characteristic stress is read in Figure 16, the critical inclusion radius for silicon oxide can be obtained. The Green and Evans criterion are very similar and predict a critical inclusion size of 36 and 40 μm, respectively. The conservative failure criterion predicts a smaller critical inclusion size of 2 μm. Although silicon oxide inclusions do not appear in the form of a crack but as spherical defects, the consideration of the inclusion as an inclusionsized crack provides a better fracture criterion because of the oriented precipitation of silicon oxide. These inclusions appear very close to each other at grain and twin boundaries. Therefore, the formation of a crack that links two or more silicon oxide inclusions is possible at a very low applied load, and this crack is the critical defect that controls the mechanical strength of silicon samples.
The relatively low values of fracture toughness measured at the bottom parts of the block could be caused by the presence of silicon oxide inclusions. The change in the critical stress intensity factor that experiences a crack approaching a silicon oxide inclusion when a uniaxial load is applied can be obtained from the graph presented by Li et al. [23]. Silicon oxide is softer than silicon, and a propagating crack must release half of the energy for its propagation when it reaches the inclusion interface. With the aid of equation (2), the critical stress intensity factor of silicon is observed to decrease from 0.9 MPa√m to 0.64 MPa√m in the presence of silicon oxide inclusions. Tensile tangential thermal stresses at the interface of an inclusion with 30 μm radius already presents 0.55 MPa√m according to Khaund et al. [22]. Thus, the application of a small uniaxial load that adds 0.09 MPa√m produces the critical stress intensity factor necessary for the crack to extend through the silicon oxide inclusion. This analysis is not able to predict the total change in the measured fracture toughness of silicon containing silicon oxide inclusions because it is dependent on how many inclusions encounter the propagating crack in its path until total fracture. However, this analysis provides a good qualitative explanation for the diminishment of the local fracture toughness of silicon when it contains silicon oxide inclusions.
According to Hashin and Shtrikman [27] the presence of silicon oxide in the silicon matrix would decrease the elastic modulus of silicon. The results presented in Figure 10 reveal values of elastic modulus beyond the averaged elastic modulus of multicrystalline silicon. The volume fraction of the silicon oxide inclusions may be too small to be sensed by the measurement of the dynamic elastic modulus.
5.3 Silicon carbide
The density of silicon carbide inclusions increased from the bottom to the top of the block due to the segregation of carbon to the upper part of the block. The radial thermal stresses are tensile and reach a value of almost 90 MPa at the inclusion interface, while the tangential stresses are compressive. Calculations of thermal stresses for silicon carbide and silicon nitride inclusions within a silicon matrix have been performed in the literature [37,38].
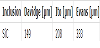
If the inclusion is considered to be spherical, the minimum critical inclusion radius for spontaneous microcracking is 208 μm for initial flaws that extend between 70° and 110° at the inclusion interface ( Table 5). The Davidge model also considers a spherical inclusion and appears to be more conservative than the Ito et al. model. If the silicon carbide inclusion is considered to be circular with an initial flaw size length of 0.2R, the critical inclusion radius is 333 μm. The observed inclusion sizes were smaller than these calculated critical radii, and therefore, spontaneous microcracking of the silicon matrix does not occur in the surroundings of silicon carbide inclusions.
When a load is applied in the surroundings of a silicon carbide inclusion, the stress field is disturbed by the presence of the inclusion, as silicon carbide has higher elastic constants than silicon. The intensification of radial elastic stress is maximum at 0° and 180° from the applied load, where the elastic stress reaches a value of ~180 MPa when a load of 150 MPa is applied. The maximum overlap of tensile radial thermal and elastic stresses occurs at an orientation of 0° and 180° from the applied load and is depicted in Figure 17. In the case that 150 MPa is applied in the vicinities of silicon carbide, the inclusion would experience 270 MPa at its interface due to the overlap of radial stresses.
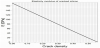
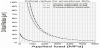
The calculated characteristic stress at 54% of the block height, measured using the three-point bending test, is considered here for microscopic failure prediction as a relevant amount of silicon carbide inclusions were observed at this block height. The calculated characteristic stress is 231.6 MPa. If the abscissas value for the characteristic stress is read in Figure 18, the critical inclusion radius for silicon carbide can be obtained. The Green criterion for circumferential cracking predicts critical inclusion radii of 32 and 16 μm for initial interfacial flaws that extend 18° and 70°, respectively. The conservative failure criterion predicts a smaller critical inclusion size of 2 μm. Silicon carbide inclusions do not have spherical forms; instead, they have angular or cylindrical forms. The consideration of a spherical inclusion can underestimate stress concentration at the corners of the inclusion. A conservative solution for this issue is the consideration made in this work of stress intensification at initial flaws at the inclusion interface. The Green failure criterion provides a better approximation than the conservative failure criterion for the critical inclusion size that causes cracking. For the purpose of this work, we select the initial flaw size that extends 70° at the inclusion interface. In this case, the inclusion critical radius is 16 μm, which is a magnitude in the range of the inclusions size observed in the multicrystalline silicon block (Figure 6).
The change in the critical stress intensity factor that a crack approaching a silicon carbide inclusion experiences when a uniaxial load is applied can be obtained from the graph presented by Li et al. [23]. The propagating crack must release approximately twice the energy for its propagation when it reaches the inclusion interface, as silicon carbide is stiffer than silicon. With the aid of equation (2), the critical stress intensity factor of silicon can be calculated to increase from 0.9 MPa√m to 1.27 MPa√m in the presence of silicon carbide inclusions. Compressive tangential thermal stresses at the interface of an inclusion with a 30 μm radius increases the toughness by 0.22 MPa√m according to the model of Khaund et al. [22]. Thus, crack propagation requires the application of a uniaxial load that induces 1.49 MPa√m. This value is higher than the 0.9 MPa√m required for crack propagation in silicon; therefore, the local fracture toughness of silicon is increased. This analysis concludes that silicon carbide inclusions may be responsible for the increase in fracture toughness measured at the upper part of the multicrystalline silicon block. The measured mechanical strength of multicrystalline silicon, containing silicon carbide inclusions with radius sizes smaller than 10 μm, would be significantly high (Figure 18). In that case, the silicon carbide inclusions would not represent a critical defect causing fracture, and the increase in fracture toughness would be noticeable.
According to Hashin and Shtrikman [27], the presence of silicon carbide in the silicon matrix would increase the elastic modulus of silicon. The elastic modulus results presented in Figure 10, which are greater than the averaged elastic modulus of silicon, may be caused by the presence of silicon carbide inclusions within the silicon matrix.
6. Conclusion
The most damaging type of impurity inclusion for the multicrystalline silicon block studied in this work was amorphous silicon oxide. Amorphous silicon oxide has a lower thermal expansion coefficient and elastic modulus than silicon. These two material properties induce the overlap of tangential thermal and elastic stresses, which enhances fracture by radial cracking. Additionally, the oriented precipitation of silicon oxide at grain and twin boundaries eases the formation of radial cracks between inclusions and decreases the mechanical strength of multicrystalline silicon.
Impurity inclusions with much larger thermal expansion coefficients than silicon, metals such as aluminium and copper, can cause spontaneous microcracking in the surroundings of metallic impurities after the crystallisation process. A low density of spontaneous microcracking is detected by a decrease, in the mechanical strength, elastic modulus and fracture toughness at the upper part of the multicrystalline silicon block.
Silicon carbide is the least deleterious type of impurity inclusion, with a higher thermal expansion coefficient and elastic modulus than silicon. These two properties increase both the fracture toughness and elastic modulus of multicrystalline silicon. Additionally, if the radius of the silicon carbide inclusions remains lower than ~10 μm, the increase in fracture toughness and elastic modulus yield higher mechanical strength of the silicon wafers.
Finally, it can be concluded that the reduction of metallic impurities within the silicon feedstock would allow the production of multicrystalline silicon with better mechanical properties. The control of oxygen precipitation is also of great importance to assure the optimal mechanical performance of silicon solar cells.
Author Contributions
T. Orellana coordinated the research carried out between the three institutions involved in this research, performed mechanical and microstructure characterization of the silicon samples, accomplished statistical data analysis and correlated the experimental results with theoretical models for results interpretation.
E. M. Tejado contributed to this work by carrying out experimentally extensive mechanical characterization and by calculating subsequently their mechanical properties.
C. Funke supervised both article content, calculation of fracture stresses and microstructure characterization of the silicon samples.
W. Fütterer calculated fracture stresses via finite element analysis from measured forces by the ring-on-ring bending test .
S. Riepe supported this work by guiding the fabrication of the investigated multicrystalline silicon as well as in material collection and characterization.
H. J. Möller supervised the experimental and theoretical research of this work and approved the interpretation of results.
J. Y. Pastor also supervised the experimental and theoretical research of this work, specially contributing to the mechanical characterization of the silicon samples and approved the interpretation of results.
Acknowledgments
The authors would like to thank M. Kwiatkowska, F. Boldt, F. Haas, P. Hauber, M. Schumann, J. Zielonka and M. Winterhalder from Fraunhofer ISE and all the colleagues from the TU Bergakademie and the Techincal University of Madrid for their valuable work that made this research possible.