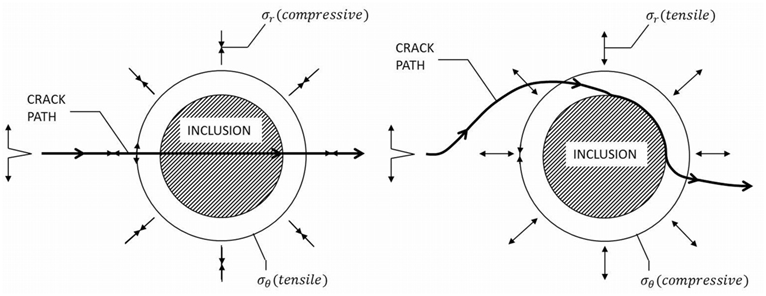
Figure 2:
The left image depicts a crack propagating through an inclusion (α
i
<α
Si
). The image on the right depicts the deflection of a crack by an inclusion (α
i
>α
Si
)
[24]
.