


1. Introduction
The Ruhr area is a region in the western part of Germany. The entire area is highly industrialised and in the past formed the basis of the coal mining industry. Due to international competition in coal mining and high and expensive (safety-) standards in Germany there has been a slow closure of mines. Today, this benefits the necessary energy turnaround and promotes the use of renewable energy sources.
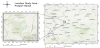
One of the most recently closed mines is Prosper-Haniel [1], which is the research area of the project "Digital-Twin - Integrated monitoring", funded by RAG Stiftung (no. 20-0013) [2]. The location of the respective area is shown in Figure 1.
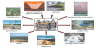
Mining processes closely affect the surrounding environment, even after mining operations have been ceased. The possible effects of mining processes are presented in the Goerke-Mallet et al. [3]. Figure 2 shows examples of the effects of mining operations. They concern the impact of mining activities on: water resources, soil movements (soil uplift and subsidence) as well as changes of vegetation cover in mining areas [3,4].
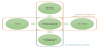
The "Digital-Twin" project based on the concept of "Industry 4.0", which again is based on the assumption that each process in the project is monitored and managed, starting from the idea, implementation, management and ending with the closure of the mine or activity in general [5]. A key aspect of the "Industry 4.0" concept is the full digital implementation of all possible data. Mining has a specific mine life cycle, which starts with the concession process, followed by the extraction of the raw material to the closure process and the postmining phase [3,4,6,7], as shown in the Figure 3.

Different sources of (geo-) data are used in the project: from satellite images, drone flights, modelling of geological structures based on available resources, in-situ measurements up to survey campaigns using mobile GIS. An important aspect of post-mining research is the continuous monitoring of the mining area to get a full process understanding. With this process understanding, important (postmining) aspects and effects can be derived and fed back into early stages of the mine life cycle. In this article, methods for monitoring post-mining processes will be presented on the example of the closed Prosper-Haniel mine.
2. Methodology
The article by Pawlik et al. [4] presents the concept of using various methods of geomonitoring of post-mining processes (Figure 4), which include satellite observations, drone flights and in-situ measurements. It is worth noting that the implementation and integration of all possible methods and research techniques, allows to carry out a comprehensive observation of the research area. The selection, the application and the fusion of individual research methods depends on the characteristics of the research area.
3. 3D- Geological Modelling
3D modelling as basis of geo- and environmental monitoring is nowadays almost impossible to imagine without. Unfortunately, the geological reservoir modelling is focused on the reservoir itself and less on the overburden structure as well as the surface layers. However, the 3D visualization capabilities give users an intuitive understanding within a virtual environment. The insights obtained in this study provide completely new and modern insights in the assessment, calculation and analysis of geology and overburden structure above the reservoir. The continuous adoption of current methods and approaches is also part of post-mining investigations. Merging of integrated information in post-mining areas, within and above the reservoir sections enables the re-evaluation and presentation of existing data. Geological models often show uncertainties for different geological ages, which vary according to their complexity and diversity.
In the research area near-surface boreholes, field surveys and samplings describe comprehensively the thin strata of the Quaternary. However, due to the small thicknesses and different substrates, 3D geological models usually do not represent near-surface horizons and in addition, these layers were not in the focus of the exploration campaigns and were not fully interpreted. Therefore, the model is limited to the depiction of the Quaternary distribution and its depth and spatial extend.
The overburden is characterized by the wide Tertiary and Cretaceous distribution of different horizons. Among them are geological units of the Triassic and Permian, which reach to the lower edge of overburden at about -600 m. The Carboniferous top surface depicts the deepest stratigraphic body of the 3D model. Within the Carboniferous are the mine installations and coal seams. Mining at Prosper-Haniel mine reached down to a maximum depth of -1200 m.
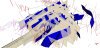
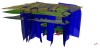
Early mining activities of Prosper-Haniel mine below the Kirchheller Heide were recorded as early as in the mid 1960‘s. The mine surveying archive data includes mining overviews, tectonical maps, isolines, profiles and 2D seismic lines at different depth levels (soles) of the reservoir. The data provide detailed information of the mining activities and enable the complete 3D reconstruction of mine installations, coal seams and geological structures in the subsurface (Figure 5). For the current work the existing data was re-evaluated and a new static geological model of the overburden was created.
Initially, the focus was on creating the fault model, because faults form barriers to geological horizons. This barriers simultaneously limit the mining fields of a mine and thus also the mine subsidence. They have a close topological relationship with the overall model. Faults shape the model geometries and significantly influence the complexity of the geological 3D model.
The evaluation and analysis of profiles, fault lines and mapping results of the Geological Survey of North Rhine-Westphalia (GD NRW) enabled a detailed reconstruction of the 3D fault surfaces. Faults encountered and documented during mining allowed conclusions to be drawn about the fault, e.g. fault-type, fault dip and fault properties (e.g. shale gauge ratio).
The model is gradually built up based on the geological and tectonical evolution. For modelling, the overburden strata boreholes from the borehole database (DABO NRW) were used. The database provided about 2.000 boreholes with different petrophysical data in the project area. With the quantitative and qualitative assessment of depth and petrophysical distributions of overburden strata was analysed. In addition to the boreholes, geological and mine profiles as well as seismic sections served as input. The entire static modelling of the faults and main geological horizons was performed within the software package MOVE (Figure 4, Figure 6).
The 3D modeling in post mining areas provides important information about the dominant subsurface structures and properties of the Mesozoic layers. In close connection with the information at the earth surface and form remote sensing, it forms a digital twin and provides important insights for a better understanding of the postmining processes (Figure 7). For the fusion of the different analyses nut only the software package MOVE but also ESRI ArcGIS Pro was utilized (Figure 4).
4. Utilisation of Drones in the Post Mining Process
Drones are used in many different scenarios in the geomonitoring of post-mining processes. Three types of drones with different sensors are employed in the project “Digital-Twin”.
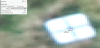
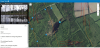
First, it is about the most recent, correct and positionally accurate localisation of facilities, terrain situations or objects in the project. For this purpose, the real-time kinematic (RTK) method is used [8]. RTK enables an in-flight correction of the standard jammed GNSS signals, so that its orthoimage generation results in an accuracy level of two to - at worst - six centimetres. For this purpose, a drone with a recording system is used which is equipped with the appropriate technology to access the NRW satellite positioning service (SAPOS [9]). Flights are carried out at different heights, depending on the objective and the desired geometric ground resolution. At a flight altitude of about 100 metres, the system delivers these results in a positional accuracy of up to two centimetres. The Figure 8 shows a so-called ground control point (GCP) which was placed using standard surveying methods (red-cross). The resulting drone orthoimage, which used the RTK correction, has shifted to North West only at about 2 cm. The achieved ground resolution and precision is applicable for the monitoring objectives of the research area, because the geodetic uncertainty of the other datasets (e.g. overburden static model) is much higher.
In similar geomonitoring projects such types of drones are use a fixed flight plan for capturing the same environmental surrounding e.g. every month to describe the phenological progress in a working area and to monitor the success on deconstruction close to nature [10].
The second type of drones uses in addition a multi-spectral sensor. The term multi-spectral camera simply refers to a camera that uses multiple channels to capture separately different wavelength bands. This would make the RGB camera a "multi" spectral camera as well, since it detects over three wavelength bands.
The here addressed multispectral sensors is able to detect five channels: Red, Green, Blue, NIR and Red Edge. For vegetation mapping applications, certain wavelength ranges are of particular importance. In the vicinity of the project area, but also in post-mining work in general, vegetation changes and the vitality of the vegetation need to be monitored, as ground movements can cause groundwater, but also possibly pollutants such as methane, to influence the root zone. Both can be documented and monitored, for example, with the help of vegetation indices. This monitoring is based on the behaviour with regard to absorption and reflection of chlorophyll a and b when exposed to sunlight. Chlorophyll of a healthy plant in the visible range absorbed especially blue and red light trough photosynthesis. The wavelengths in the range in the near infrared wavelength range are strongly reflected. This protected the plants from overheating [11]. Suitable indices put these wavelength ranges in relation to each other in order to evaluate the plant health and thus, for example, the influences of mining activities [4,12].
In the frame of the “Digital-Twin” Project multispectral drone images are used to get a detailed view on the situation when satellite imagery analysis of vegetation indices showed problems. Due to the much better ground resolution of the drone cameras (e.g. 6 cm in a flight altitude of 120 m) this images are crucial for the groundtruthing process (Figure 9).
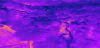
The third drone-based sensor of interest is the thermal infrared sensor. The development of cameras has advanced in two respects: On the one hand, the miniaturisation of chips has advanced so that today considerably higher geometric resolutions are available on the same area or comparable resolutions on a smaller area than was conceivable 10 years ago. In addition, chip downsizing also created the basis for making the overall device small and light, so that copter operation became feasible in widespread use.
In a narrow range of thermal infrared radiation, thermal imaging cameras or so-called thermal infrared cameras (tIR cameras) capture a spectral range that is not visible to humans but rather tangible - thermal radiation. Thermal radiation lies in the mid-infrared range between 3,000 nm and 50,000 nm and thus far beyond the light visible to us (380 nm to 780 nm) in the long-wave range of the spectrum. The way it works is that every substance or body emits thermal radiation. A commercially available thermal imaging camera picks this up via optics coated with germanium or zinc salt alloys and focuses radiation usually in wavelengths between 7,000 nm and 14,000 nm on a so-called focal plane array, a microbolometer, which reacts to thermal radiation in a few milliseconds and sends an electrical pulse to the outside. In the meantime, such microbolometers, for example in the cameras of the companies FLIR and OPTRIS, are only 17,000 nm by 17,000 nm in size and can still register thermal radiation from distances of up to 12 km [13,14].
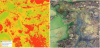
Within the project tIR cameras gives additional hints on changes in plantcover/vegetation and drought/wetness of soils due to underground movements. As an example: Ground water has a more or less constant temperature. When it affects the soil one easily can detect the anomalies in comparison with the surrounding using a tIR camera. The exemplary recorded image from 28 September 2021 shows, especially in comparison with the multispectral image in Figure 10, that open areas along the brooks warm up much more strongly than, for example, the surrounding tree population or the low forest-like vegetation in the area of the ground sensors (blue dots). This is also clearly visible in the grassland areas in the southwest of the tIR image. In addition, the water flow of the brook is visible very well. It can be assumed that a detailed evaluation of the area with both sensors will lead to significantly improved results in the interpretation of the vegetation distribution and vegetation vitality.
5. Remote Sensing
One of the modern methods of geo-monitoring of post-mining processes are satellite observations. The sources of data for the "Digital- Twin" project are satellite missions: ESA - Copernicus programme and NASA - Landsat programme. Before starting the research, it is necessary to get acquainted with the technical specifications of particular space missions, as they may differ in spectral characteristics, spatial resolution as well as in time range, in which particular satellite images are acquired [15]. An example of research based on satellite images are spatio-temporal analyses, which make it possible to observe long-term changes occurring on the surface.
In the framework of the "Digital-Twin" project, research is being conducted into the vegetation of mining areas. The article by Pawlik et al. [15] presents a classification of vegetation indicators that can be used to observe changes in the vitality of vegetation in mining areas. The classification includes four groups: based on the minimum number of channels used to calculate the indicators; based on calculations which use a "soil line"; taking into account the influence of the atmosphere and examining the chlorophyll content of the vegetation [15].
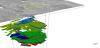
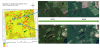
One example is the Normalized Difference Vegetation Index (NDVI) pioneered by Rouse et al. [16]. Research is being conducted to understand the impact of post-miming processes on vegetation. It should also be noted that a decrease in vegetation in mining areas may not be only related to the mining process, but also to e.g climate change, storms and natural disasters. It is therefore important to distinguish between the causes of phenomena in a given area. The Figure 11 shows a temporal and spatial analysis of the vegetation index - NDVI for the period 2015-2020 in the area of the closed Prosper-Haniel mine. It is worth noting that there are environmental changes in the area, where one can see e.g. the development of water surfaces marked in blue. A comparison of satellite images from 2015 and 2020 is shown on the right-hand side of the Figure 11.
6. Mobile GIS
An important aspect of any research should be the verification and thus improvement of the results obtained. One of the methods that makes this possible is mobile GIS (mGIS) as an integrated platform based on hardware and software that allows access to geodata and geospatial services by means of mobile devices equipped with data transmission (e.g. 3G, 4G, 5G) and location systems (e.g. GNSS) [17].
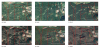
Field verification using a mobile application makes it possible to document and map sites with drawings, descriptions and photographs. Thus, mobile mapping is ultimately a technology-based, sensible further development of classic field mapping. This is particularly important in the context of completing field information, especially in forest areas, as only tree crowns can be seen on both satellite and drone imagery. On the other hand, mGIS makes it possible to verify places located below the level of tree crowns. In the "Digital-Twin" project the data are collected using a mobile application by ESRI - Survey123 [18] form, which allows the location-based collection of descriptive data together with photo documentation. Before starting to collect data in the field, an analysis of potential observation sites had to be carried out. For this purpose a three-dimensional model of geological structure was used. The Figure 12 shows examples of observed changes in the environment. The data were used as a basemap for data collection by means of a mobile application running on a mobile device. The accuracy of the measurement depends on the location system and the number of satellites available in a given research area. The higher the number of satellites, the better the accuracy.
7. Discussion
The implementation of various methods of geo-and environmental monitoring of post-mining processes depends on the specific research area. Before starting the studies, the characteristics of the site must be known and appropriate methods and instruments has to be selected. Satellite remote sensing allows the acquisition of information about the terrain with low spatial resolution (from 10m to 30m) [15] but on a high temporal scale (about every 6 days). The use of drones, which are characterised by a higher spatial resolution, obtain results with a smaller spatial extend. Thanks to the low flying altitude of drone flights, it is possible to obtain data even on cloudy days, where it is not possible to obtain data from satellite observation [4].
The use of data from different periods allows for a complete understanding of environmental processes. Satellite observations have been carried out since the 1970s [15]. This allows the creation of spatio-temporal analyses with the use of satellite images, which make it possible to present changes and trends occurring on the surface of the Earth.
Three-dimensional modelling of geological structures makes it possible to study tectonic elements and structural heterogeneities in the studied area. By verifying, the obtained 3D model with satellite and drone images and using mobile GIS it is possible to understand the phenomena and environmental processes. An important aspect is the distinction between natural causes (droughts, dangerous weather phenomena (strong wind)) and those caused by mining activities (subsidence, formation of polders, changes in vegetation). Therefore, in order to understand and interpret a given phenomenon, it is necessary to consider the system as a whole. For this, in addition to instruments and methods, knowledge and experience of experts are needed [4]. The Table 1 below shows examples of the effects of mining activities and suggests methods of observation adapted to them.

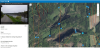
By integrating data from the geological modelling (presented in the 3D Geological Modelling subsection) and data from the Bezirksregierung Köln, a spatiotemporal analysis of terrain changes in the area of the closed Prosper-Haniel mine is presented in Figure 13. This analysis indicates that the formation of water surfaces was initiated between 2002 and 2006 (Figure 13B) and between 2012 and 2015 (Figure 13D) and can be closely linked to the occurrence of tectonic faults in these areas (red lines in Figure 13).
In order to answer the question of whether potential tectonic faults could have been the cause of the formation of these water surfaces, it is necessary to know the characteristics of the terrain and whether the terrain has been lowered over a given period of time (Figure 14), e.g. by mining activities.
According to the profile shown, it can be seen that at the site of the formed water surface, the land has receded by fast 10m in 24 years.
Figure 15 shows the location of the water surface observed using mobile GIS.
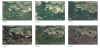
Research on this research area has been conducted for many years. The paper by Padmanaban et al. [20] presents an analysis of vegetation changes based on NDVI calculated for data from the Landsat space mission from 2013-2016. The result of the research was to indicate the location of two subsidence zones. Figure 16 shows these subsidence zones using orthophoto maps from Bezirksregierung Köln [19] for the period 2002-2020. It can be noted that the formation of the subsidence zones occurred between 2002 and 2006 (Figure 16b). Between 2006 and 2020, the water areas of both sites increased significantly.
The post-mining processes last for a long period of time as shown in Figures 13, 14 and 16. Therefore, continuous geomonitoring of mining areas is an important issue. The presented visual assessment of the variability of the ground surface is only an example of the wide possibilities of using the data presented in this article for geomonitoring of the post-mining processes.
8. Conclusions
The above presented methods of observing phenomena occurring in the area of the closed Prosper-Haniel mine can also be implemented in future research on observing post-mining processes occurring all over the world. An important aspect is the adaptation of the methods to the respective mining area. The combination of geomonitoring methods makes it possible to present a comprehensive environmental situation in a given area. Thanks to such integration, it is possible to obtain future concessions for energy industry activities within the framework of current technological changes.
Competing Interests
The authors declare that they have no competing interests.
Author Contributions
Conceptualization, M.P, M.G., B.B., T.R, and J.B.; Methodology, M.P, M.G., B.B., T.R, and J.B.; Software, M.P., M.G. and B.B..; Formal analysis, M.P, M.G. and B.B ; Resources M.P., M.G. and B.B; Writingoriginal draft preparation, M.P, M.G., B.B., T.R, and J.B.; Writingreview and editing, M.P, T.R. and J.B.; Visualization, M.P, M.G., B.B.,; Supervision, M.P. and T.R. ; Project administration, M.P. and T.R.; All authors have read and agreed to the published version of the manuscript.
Publisher's Note
All claims expressed in this article are solely those of the authors and do not necessarily represent those of their affiliated organizations, or those of the publisher, the editors and the reviewers. Any product that may be evaluated in this article, or claim that may be made by its manufacturer, is not guaranteed or endorsed by the publisher. Graphy Publications remains neutral with regard to jurisdictional claims in published maps.