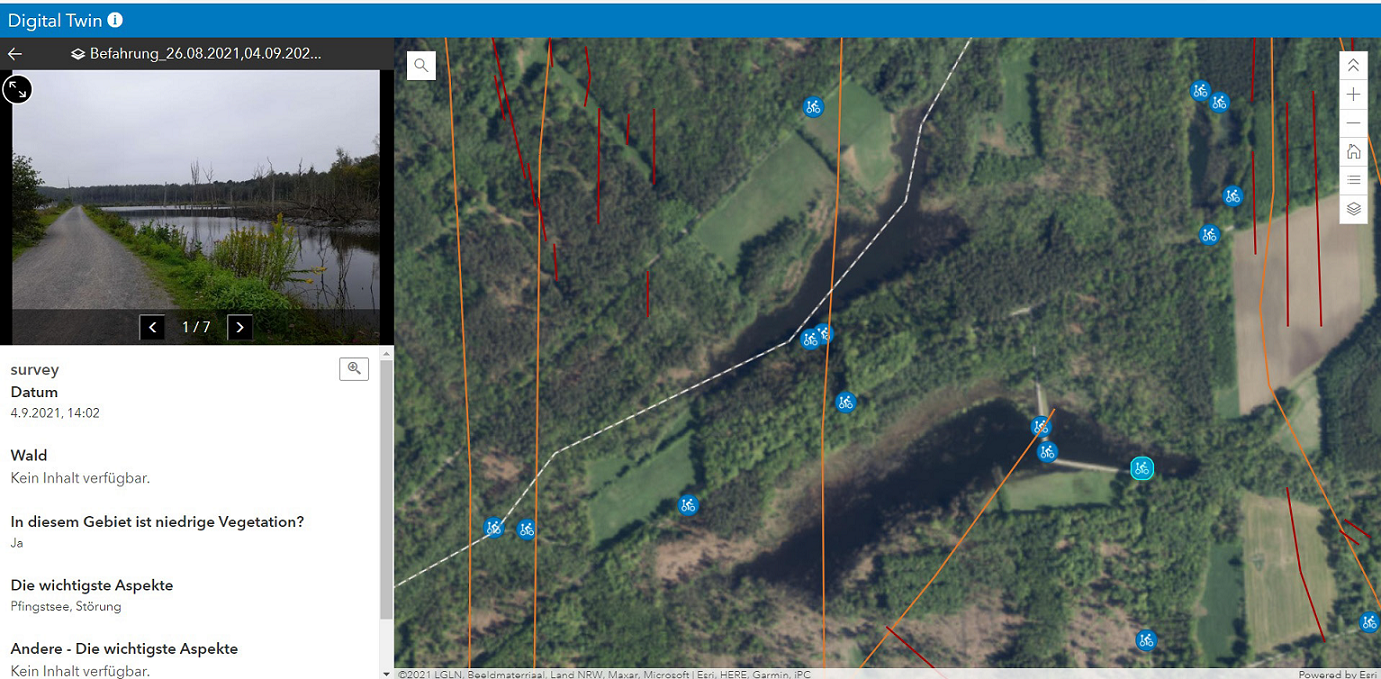
Figure 12:
The design of the mobile GIS application. The orange lines indicate tectonic faults and the red lines indicate lineaments that have been vectorised using data from mining and geological maps.