


1. Introduction
Peroxyacetyl nitrate (PAN) is formed via the oxidation or photolysis of oxygenated volatile organic compounds (oVOCs) in the presence of NO2 [1-2]. PAN is phytotoxic in high concentrations [3-4], and is a powerful lachrymator formed in photochemical air pollution [5-6]. It can allow NOx to be sequestered and transported over long distances and then be released under high temperature conditions (lower troposphere) resulting in the production of ozone (O3) as well as hydroxyl radicals (OH) in remote regions [7-15]. The atmospheric loss for PAN is predominantly from thermal decomposition [16-19] because of its small photolysis rate [20], slow reaction with OH [20-21], and low wet deposition rate [22-23].
PAN has no known direct emission sources and is therefore an excellent indicator of the photochemical processing of an air mass which plays a significant role in the atmospheric transport of reactive nitrogen on a regional and global scale. Quantification of the spatial distribution of PAN and its global budget can be a useful tool in determining the oxidative reactions involved in the formation of O3 as well as other secondary air pollutants (e.g. nitric acid). In spite of its importance in the chemical processing of the troposphere, there are numerous measurements of PAN from different urban and remote areas [11,24-53], but these measurements are sparse both in space and time. The measurements of the temporal variability of PAN are necessary to evaluate the global budget of O3, NOy, HOx, and the associated recycling of NOx. Thus, we present the global burden and the global distribution of PAN from the STOCHEM-CRI global chemistry transport model. We compare STOCHEM model results with a wide range of observations of PAN from the flight data set compiled by Emmons et al. [54], Horowitz et al. [55], and Fischer et al. [56] and twenty individual field campaign data set. The effects of additional HOx recycling mechanisms involving isomerisation of isoprene-derived peroxy radicals [57] and propagating channels for the reactions of HO2 with acyl peroxy radicals, RCO3 [58] in both present and preindustrial scenarios are shown in the study.
2. Methods
2.1 Model description
STOCHEM is a global 3-dimensional tropospheric chemistry transport model that adopts a Lagrangian approach splitting the troposphere into 50,000 constant mass air parcels which are advected by meteorological data from the UKMO Hadley Centre global general circulation model called the Unified Model (UM). The Lagrangian cells are based on a grid resolution of 1.25° longitude, 0.8333° latitude, and 12 unevenly spaced (with respect to altitude) vertical levels between the surface and an upper boundary of 100 hPa [59-60]. The resulting simulated concentrations are mapped onto an Eulerian grid resolution of 5° by 5° with 9 equally vertically spaced pressure levels, each 100 hPa thick. A detailed description of the dispersion processes including the vertical coordinate, advection scheme used in STOCHEM can be found in Collins et al. [59] with updates described by Derwent et al. [61].
The STOCHEM-CRI model utilises the Common Representative Intermediates version 2 and reduction 5 chemical mechanism. The CRI v2-R5 was built using a series of five-day box model simulations on each species, on a compound-by-compound basis. The performance of the chemistry of these simulations was optimised using the Master Chemical Mechanism (MCM) with O3 production being the primary criterion [62]. Simulations completed over a range of 32 VOC/NOx ratios by CRI v2-R5 have shown compelling agreement with MCM v3.1 for ozone and other radical and closed-shell species (including PAN), hence establishing it as an appropriate reference mechanism for the use in global chemistry transport models [63-64]. The details of the CRI v2-R5 mechanism is given by Jenkin et al. [65], Watson et al. [64], and Utembe et al. [66] with updates highlighted in Utembe et al. [60]. The emissions data employed in the base case STOCHEM model were adapted from the Precursor of O3 and their Effects in the Troposphere (POET) inventory [67] for the year 1998. More details about the global emission data used in the STOCHEM can be found in Khan et al. [68].
The additional HOx recycling mechanisms involving isomerisation of isoprene-derived peroxy radicals [57,69-70] and the propagating channels for the reactions of acyl peroxy radicals with HO2 [58] have been introduced into the STOCHEM-CRI. In isoprene induced HOx recycling mechanism, the intermolecular rearrangements of isoprene derived alkyl peroxy radicals were sufficiently rapid to compete with biomolecular routes leading to two additional oxidation pathways of the alkyl peroxy radicals at low NOx levels. The two additional pathways involve 1,5-H-shift resulting in OH, HCHO and methyl vinyl ketone (MVK) or methacrolein (MACR) formation; and 1,6-H-shift leading to the formation of HO2 and a hydroperoxyaldehyde (HPALD), which is removed predominantly by rapid photolysis to generate additional OH and other radical products.
Two experiments were conducted as the base case reference run referred to as ‘Base’ described in Utembe et al. [60] and a model including the isoprene HOx recycling and radical propagation in a simulation referred to as ‘ISOP’. Two further experiments (referred to as ‘B1800’ and ‘ISOP1800’) were performed for a preindustrial scenario described in Khan et al. [71]. All simulations were conducted with meteorology from 1998 for a period of 24 months with the first 12 allowing the model to spin up. Analysis is performed on the subsequent 12 months of data.
3. Results
3.1 The global burden of PAN for the present scenario and the HOx recycling impact on its burden
In the model, PAN is produced entirely from the reaction of acetyl peroxy radicals (CH3CO3) with NO2. The formation of CH3CO3 from a suite of VOC oxidation processes are summarized in Appendix A. The greater input of the organic materials and the greater complexity of the chemistry scheme in the CRI v2-R5 mechanism of the STOCHEM model [60], leads to a global burden of 398 Gg(N) PAN for the present scenario. The globally averaged tropospheric lifetimes of PAN is found to be 9.3 hours, the value being close to those reported by Singh [9], and Roberts et al. [42]. The HOx recycling mechanism employed in the STOCHEM-CRI gives consistent results with the box model simulations in Archibald et al. [69] and with the parameterized representations of Lelieveld et al. [72] and Pugh et al. [73]. The reduced total PAN global burden (346 Gg(N)) in the study are driven by the decreased production of CH3CO3 (e.g. 11% less CH3CO3 production in the ISOP scenario compared with the base case scenario) leading to the global decrease of PAN by 13% for the present scenario which given that the base simulation generally over-predicts PAN brings the model into closer agreement with measured values. However, the concentrations of CH3CO3 molecules is a balance between faster production via VOC oxidation and faster removal via reaction with HO2, NO, NO3 and partitioning into PAN species [74]. The inclusion of HOx recycling mechanisms leads to a slight decrease in the tropospheric lifetime of PAN (9.0 hours).
3.2 Surface and zonal distribution of PAN for the present scenario
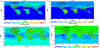
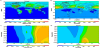
The annual mean surface and zonal distribution of PAN from STOCHEM-CRI and their comparison with STOCHEM-ISOP for the present scenario are shown in Figure 1 and Figure 2, respectively. The surface distribution of PAN is driven by the location of NOx and VOC emissions. Biomass burning and vegetation emissions of NOx (15 Tg (N)/yr) are located in forested regions. Anthropogenic emissions of NOx are predominantly distributed over North America, central Europe and South East Asia with a total emissions of 31 Tg (N)/yr. During June-July-August (J-J-A), the concentrations of PAN are found in between 0.7 to 1.0 ppbv over the continents (Figure 1a). Air masses containing high NOx mixing ratios and high levels of VOCs favour PAN production over the continents with a maximum of 2.0 ppbv over the polluted regions of North America (Figure 1a). During December-January-February (D-J-F) and J-J-A, the mixing ratio of PAN is found to be up to 1.2 ppbv over the forested regions near the equator (Figure 1a and Figure 1b). The increased biomass burning activity and formation from the degradation chemistry of both isoprene and monoterpenes in STOCHEM-CRI [60] lead to more PAN formation over forested regions. The more complex mechanism in STOCHEM-CRI shows the importance of PAN especially from isoprene and continued work in improving measurement techniques, increasing the amount of measurements and improving mechanistic understanding is essential. The inclusion of HOx recycling leads to an increase of PAN over source regions by as much as 10% and a decrease of PAN over sink regions by as much as 40% (Figure 1c and Figure 1d).
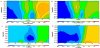
The zonal mean of PAN for STOCHEM-CRI shows its highest level between 50°N-90°N during J-J-A (up to 0.5 ppb) at 300-600 hPa and between 10°S-5°S during D-J-F (up to 0.4 ppb) at 300-500 hPa (Figure 2a and Figure 2b). These high levels of PAN are related predominantly to anthropogenic activity between 30°N and 60°N and the result of vegetative and biomass burning activity over the tropics. The high levels of PAN at the top of the model domain are found because of the upward transport from PAN production regions as well as the less significant removal process (e.g. thermal decomposition) in the upper troposphere with the lower temperatures encountered. The maximum PAN levels in the region of 50°N-90°N during J-J-A at the middle to upper tropospheric region in this study (Figure 2a) is consistent with the global modelling results from the GEOS-Chem model presented by Fischer et al. [56] which indicates the highest PAN concentrations at 4-10 km in the region of 30-60°N in J-J-A. The inclusion of HOx recycling leads to a decrease of PAN by up to 30% in the tropics (during J-J-A) and in the remote SH regions (during D-J-F) (Figure 2c and Figure 2d) due to the decreased productions of CH3CO3.
3.3 Model-measurement comparison
The data compilation of Emmons et al. [54], Horowitz et al. [55], and Fischer et al. [56] containing measurements of PAN from a selection of aircraft campaigns (see Appendix B for more details) produced a set of data representing a broad distribution of regions throughout the troposphere which was used to compare with the modelled PAN in order to evaluate model performance (Figure 3). The CRI mechanism in STOCHEM over-predicts the upper tropospheric PAN substantially for most of the locations relative to the measured data. Similar results were found in the global modelling results from the MATCH v3 model showed by von Kuhlmann et al. [75] in where the model over-predicted PAN in the remote troposphere and more often at higher altitudes. In general, PAN concentrations increase with altitude in the troposphere because of the increased thermochemical stability in the cold upper troposphere. The differences between average modelled and observed PAN concentrations for all locations referred to by mean biases are found to be +17 and +80 pptv for the lower troposphere (~0-4 km) and upper troposphere (~6-12 km), respectively.
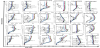
The increases in PAN in our study are driven by an increase of the CH3CO3 (which is the precursor radical) due to the increased complexity of the emitted VOC speciation represented in STOCHEMCRI. Among all of the campaigns, the regions dominated by vegetation and biomass burning emissions (e.g. TRACE-A) have higher PAN levels and the model PAN in the bottom five levels (up to 5 km) fit reasonably well with the measured mean. The over-prediction of PAN in the upper troposphere could be due to the higher abundances of CH3CO3 in the STOCHEM-CRI model, which are ubiquitously distributed throughout the troposphere because of its formation during the oxidation of most NMVOCs [76]. PEM-Tropics A was a campaign to investigate the effect of biomass burning on the NOy species in the remote Pacific during September and October. Fiji, Tahiti and Christmas Island belongs in the PEM-Tropics campaign region where there is a good overall agreement between model and measurements. However there are large overestimations of model PAN in Fiji and Hawaii during the PEM-Tropics B campaign which was performed during March-April with minor biomass burning effects. This could indicate that convection in the model transports CH3CO3 precursors into the higher altitudes where PAN is formed with a longer life-time during March-April. The model mean PAN fit well within one standard deviation of the measured mean over Japan (Trace-P) where there were periods of clean air from the Pacific and Asian outflow. The model mean PAN also produces good agreement with measurements at Labrador (A3B), Mexico (MILAGRO), Eastern North America (INTEX-A) and worse agreement at Ireland (SONEX), Greenland (POLARCAT), North American Arctic (ARCTAS), East coast Japan (PWA and PWB), north Pacific (PWA), and Philippine sea (PWB) in where the model overestimates PAN in the upper troposphere by a factor of 2-3. The overestimate of PAN in the regions may be due to the higher abundances of CH3CO3 precursors, high NOx concentrations in the main source regions for PAN, lightning, and uncertainties of the formation or decomposition rate of PAN. The HOx recycling caused an increase in OH, reducing the lifetimes of NMVOCs resulting in a decrease in CH3CO3 concentrations to produce PAN at the free troposphere, which has improved agreement with measurements for most of the locations. The mean biases from measurements are reduced by 90% and 40% for the lower troposphere and upper troposphere, respectively upon addition of HOx recycling in STOCHEM-CRI.
The rate coefficient of the temperature dependent PAN formation used in the STOCHEM-CRI model (k0=2.7×10⁻²⁸(T/300)-7.1 cm6 molecule-2s-1 and k∞=12.1×10⁻¹²(T/300)-0.9 cm3 molecule-1 s-1) were subsequently perturbed upwards and downwards by considering the uncertainties of the rate coefficients. Therefore, two more simulations were performed with two sets of different PAN formation rates deviating k0 by ± 50% and k∞ by ± 15% from the unperturbed run with a high rate coefficient referred as “STOCHEM-HIGHK” and with low rate coefficient referred as “STOCHEM-LOWK”. The STOCHEM-HIGHK run shows the average increase of PAN mixing ratios in the lower and upper troposphere by 6% and 4%, respectively. In the STOCHEM-LOWK run, the overestimate of the average model PAN for all campaign sites is reduced by 5% and 7% at the lower and upper troposphere, respectively, but the decrease of PAN mixing ratios with altitude above ~6 km is not large enough to decrease the discrepancy of the model-measurement PAN data especially in the upper troposphere.
Twenty surface measurement campaigns have been compiled to form a dataset of PAN (more details in Appendix C) which have also been used to evaluate the model performance. Figure 4 shows the comparison of the seasonal cycle of model PAN mixing ratios with the surface measurements for a series of locations. The modelled PAN does not exhibit a clear seasonal correlation for most of the stations (Figure 4). The seasonality of PAN is found to be sensitive to temperature (through the thermal decomposition rate of PAN), OH mixing ratios and sunlight. However, PAN is long-lived with respect to reaction with OH or photolysis and its lifetime in the boundary layer is controlled by thermal decomposition and by transport and decomposition. During summer, the enhancement in the PAN formation rate would be expected because of the increased formation of CH3CO3 during the oxidation of VOCs by OH. However, the accompanying increased temperature is also responsible for the rapid increase in the rate of thermal decomposition of PAN. These combined effects lead to larger PAN abundances either during spring or during summer, depending on the location and meteorological condition.
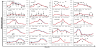
PAN abundances at NH stations are at a maximum during April- May-June due to higher photochemical production in the presence of VOC and sunlight when they have a longer thermal lifetime [77-78] and at a minimum during November-December-January because of the lower photochemical production rate from CH3CO3 and NO2. The medium to long-range transportation of polluted air masses from the European boundary layer at European stations (e.g. Jungfraujoch, Lindau, Harwell, Munich, and Athens) resulted in a maximum model PAN in spring, which is consistent with the measurement data. The abundances of both model and measured PAN at Asian stations (e.g. Seoul, Beijing, Lanzhou, and Rishiri Island) during July-August are found to be lower than expected because of the significant thermal decomposition of PAN during these months. The model produces less PAN over East Asia (e.g. Beijing, Lanzhou, and Seoul) because of using limited anthropogenic aromatic emissions in STOCHEM-CRI. Fischer et al. [56] performed a simulation with inclusion of emissions of aromatic species and found that the aromatics can account for 30% of the PAN in the Asian outflow region. The overestimation of model data compared with measurement data is found for most of the US stations (e.g. North Carolina, Frijoles, Nashville, Georgia, and Mount Bachelor Observatory) and also Greenland could be due to the overprediction of model NOx emissions and CH3CO3 formation.
Both the model and surface PAN observations indicate that the springtime maximum is pronounced at Zeppelin Mountain near NyÅlesund, Svalbard which is due to long range transport of pollutants from northern mid-latitudes sources [12,36]. During summer, the maximum thermal decomposition of PAN at Zeppelin Mountain occurs [36] and the transport of midlatitude air into high northern latitudes is likely [79] which resulted in the summer minimum. During fall, the transport and temperature favours higher PAN levels at Zeppelin Mountain, but during winter, the photochemical production of PAN is reduced due to the lack of sunlight in midlatitudes [36].
The SH stations (e.g. coastal Antarctica, Neumayer, and Santiago) show an analogous seasonal trend with maximum and minimum mixing ratios found in spring (September-October) and winter seasons (December-January-February). The surface PAN mixing ratios in Antarctica (e.g. coastal Antarctica and Neumayer) is found to be lower than that in the Arctic because the larger distance from other continents makes the transport of PAN or its precursors to Antarctica less effective.
3.4 Preindustrial scenario and implication of HOx recycling
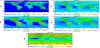
The relative changes of surface mixing ratios of PAN (up to 0.6 ppb) from preindustrial to present day scenarios are found in the NH in between 30°N and 60°N due to greater anthropogenic sources of NOx and VOCs in the present day scenario (Figures 5a and 5c). The percentage change results show that the mean surface PAN mixing ratios have increased since preindustrial times by 400% in the most of the NH surface (maximum changes of up to 1500% near the equator remote region) and by 100% in the SH. Mixing ratios in the upper troposphere have increased by 400-600% largely in between 20°N to 35°N. The percentage changes decline with altitude and are smaller away from the strong anthropogenic source region (Figures 5b and 5d). The increased PAN in the present day scenario contribute significantly to the total reactive nitrogen (NOy) budget in the troposphere, especially in the NH. The global burden of PAN has increased from 220 Gg(N) in CRI1800 to 398 Gg(N) in the base simulation, which is an increase of 81%.
The importance of the HOx recycling mechanisms with reference to oxygenated peroxy radicals is caused by an increase in HOx levels by up to 60% over land (Figure 6a). The increased OH from isoprene recycling has a greater effect than the decreased OH production from the oxygenated peroxy radicals with an increment of OH global burden by 5%. A decrease in NOx for ISOP-1800 relative to B-1800 is found over most of the areas with the largest percentage changes (up to 25% decrease) over the remote oceanic regions (Figure 6b), only two areas (e.g. Amazon and South-East Asia) in where the annual mean NOx are increased by up to 2% because of the increased biomass burning and vegetation NOx emissions from the Amazon and anthropogenic NOx emissions from South-East Asia. The isoprene concentrations in South-East Asia are lower than that in Amazon [69], but the large change in NOx for South-East Asia has led to a much more significant effect of the recycling chemistry in this region. This highlights the important balance between isoprene emissions and NOx levels.
HOx recycling occurs at low NOx levels and thus removing the NOx from anthropogenic sources in the preindustrial scenario makes the recycling more efficient. The inclusion of HOx recycling leads to a decrease in PAN (Figure 6d) and an increase in HNO3 formation over emission regions (Figure 6c). HNO3 is rapidly deposited over land and its removal leads to reduced global levels of gaseous oxidised nitrogen species (e.g. PAN) which leads to less oxidised nitrogen being transported to remote regions and thus the largest percentage changes in NOx are observed over the remote oceanic regions (Figure 6b).
The changes in O3 are driven by the redistribution of NOx which is found to be largest in remote oceanic regions (Figure 6e). The greatest percentage change (up to 9% decrease) in O3 concentration is found at the surface in equatorial regions upon including HOx recycling in the preindustrial scenario.
4. Conclusion
The complexity of the VOC degradation in STOCHEM-CRI resulted in an increase of tropospheric PAN which act as nitrogen reservoir species before releasing and transporting reactive nitrogen (NOx) away from the pollution centers. The increase in the level of PAN with altitude is consistent with reduced thermal decomposition in the upper troposphere. The overall comparison between measurements and simulations show that STOCHEM-CRI overpredicts the concentrations of PAN in the troposphere. The global burden of PAN for the present scenario is found to be 398 Gg(N) and the inclusion of HOx recycling reduces PAN by as much as 13%, bringing the model into closer agreement with measured values. The globally averaged tropospheric lifetimes of PAN is found to be 9.3 hours. The abundance of PAN have been seen in the continental atmosphere, with mixing ratios up to 2.0 ppb over the polluted regions of North America during J-J-A and up to 1.2 ppb over the Amazon rainforest during D-J-F. The inclusion of HOx recycling leads to a decrease of PAN by up to 40% over the oceans in the surface layers and by up to 10% in the low to middle tropospheric layer of equatorial regions (during J-J-A) and SH regions (during D-J-F) in a present scenario. The maximum percentage changes (up to 1500%) from preindustrial to present scenarios for PAN are found near the equator remote region and the inclusion of HOx recycling in the preindustrial scenario can decrease O3 concentrations by up to 9%.
Competing Interests
The authors declare that they have no competing interests.
Acknowledgments
ATA thanks GWR and the U.K. Met. Office for funding (studentship), MCC thanks EPSRC for a studentship, DES and CJP thank NERC and Bristol ChemLabS under whose auspices various aspects of this work was funded.