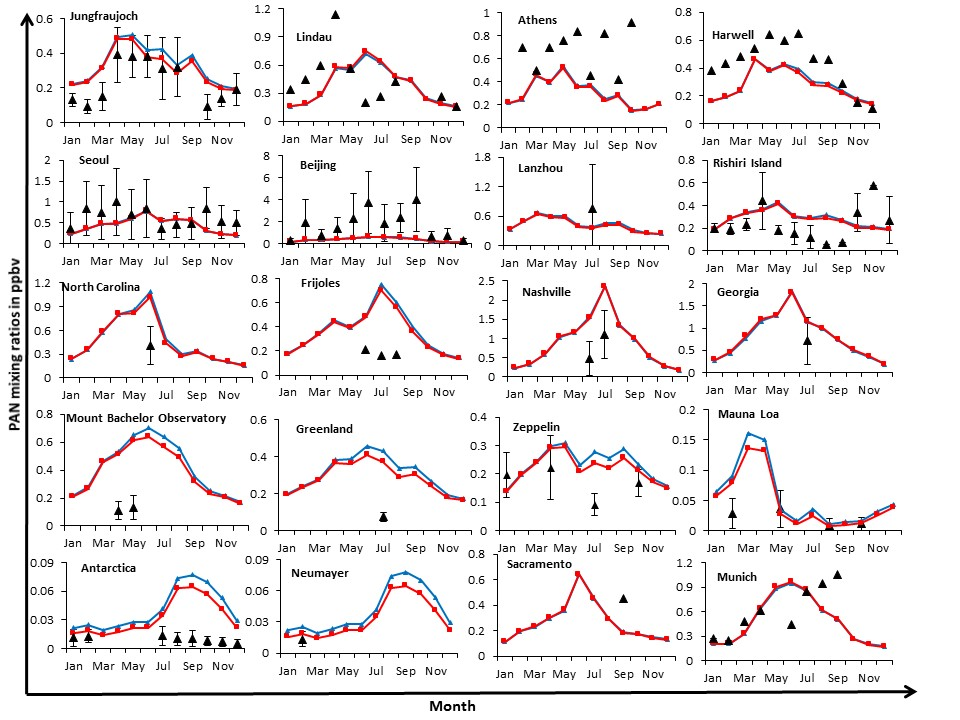
Figure 4: Monthly variation of surface global PAN mixing ratios of selected monitoring stations. Blue and red lines represent mean calculated values of PAN produced by STOCHEM-base and STOCHEM-ISOP, respectively. Black triangles represent the measurement data and the black error bars represent measurement variability.