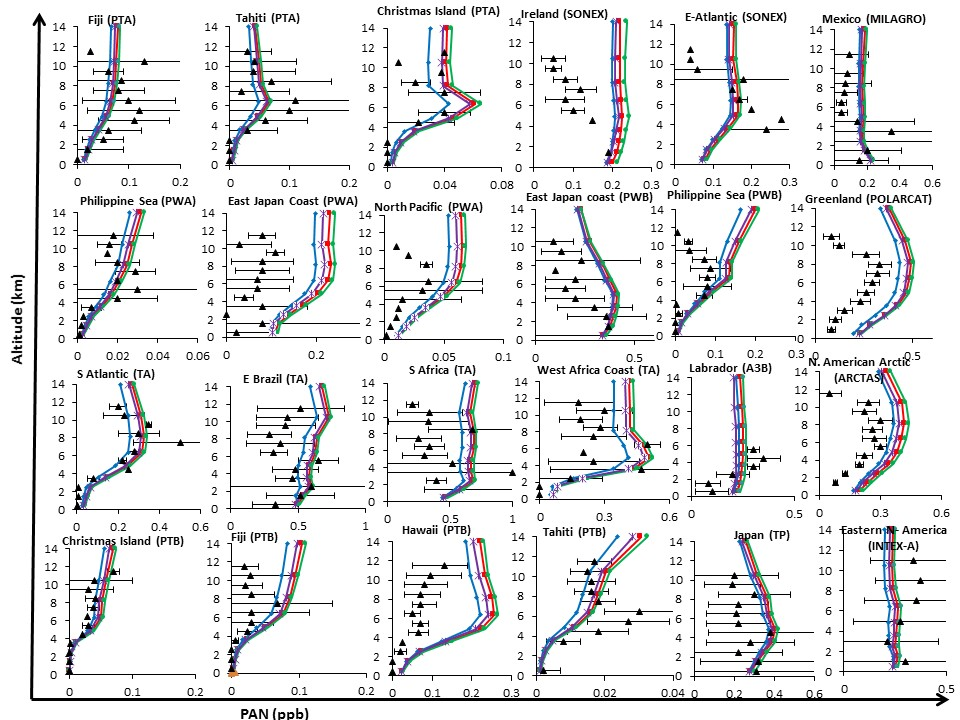
Figure 3: Vertical profiles for measured and modelled PAN, using the aircraft measurement and the STOCHEM-CRI calculations. Red, blue, green, and violet lines represent mean calculated values of PAN produced by the STOCHEM-base, the STOCHEM-ISOP, the STOCHEM-HIGHK, and the STOCHEM-LOWK respectively. Black triangles represent the measurement PAN data and the black error bars represent measurement variability.