


1. Introduction
Muscle fatigue is an essential phenomenon in a variety of sports activities and rehabilitation. The previous study defined muscle fatigue as the state in which the ability to output strength and power decreased [1]. The fatigue is known to be caused by changes in various components including cardiorespiratory functions, energy consumption and change in state of muscle fibers themselves [2,3] .
The repetition of maximal contraction reduced discharge frequency of spinal motoneurons, which reduced muscle force without muscle contraction speed, and some motor units, might stop firing altogether [4]. The previous study showed that the decrease of continuous force or evoked force on submaximal contractions was affected by spinal and supraspinal factors [5].
Possible involvement of functional changes in the central nervous system (CNS) in muscle fatigue has been considered. It was suggested that a decrease in the activity of the motor cortex pathway to muscle might contribute to fatigue so that the neural activity cannot maintain to drive the muscle to generate its full force [6]. In the previous study, it was called this decrease in voluntary activation of muscle by the decline of motor command supraspinal fatigue [7]. Evidence supporting the presence of central factors in fatigue has been accumulating in recent studies [6, 8-11]. For example, it was showed that increases in the muscle twitch force could be induced by transcranial magnetic stimulation (TMS) in the superimposed twitch in fatigue phase of sustained maximum voluntary contraction (MVC) and pointed out that CNS did not adequately drive the motoneurons innervating the fatigued muscle in the fatigue phase [12]. Also, evidence for a central contribution to fatigue observed during submaximal sustained contraction [5]. However, the exact extent of central factors in the decline of muscle force output during fatigue is still not clear.
In the hypothesis on this study, if the decrease of the torque by sustained contraction of the fatigue of muscle, such as depletion of energy substrates, as well as caused the induction of torque by electrical stimulation, such as the rise of torque should not occur. However, considered if fatigue of the central nervous system (CNS), the input from the motor neurons to decline, even if the decline is happening is the torque of the sustained contraction as a result, induce torque by electrical stimulation should be raised.
To evaluate the extent of neural contributions in muscle fatigue, we compared variables of muscle force and electromyographic (EMG) activity before and after the muscle fatigue induced by sustained isometric plantar flexion (IPF).
2. Methods
Eight male and two female subjects participated in this study (age 22.1 ± 0.5 years, mean ± standard deviation). The subjects were healthy and without a history of serious injury in the lower extremity, especially, in the ankle joint. They were fully informed about the risk of experiment and signed an informed consent document before the experiment. Ethics Committee for the Human Subject Researches in Health Science University approved this study.
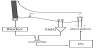
The experiments were done on the right ankle, which was in the dominant leg for all of the subjects. The Biodex system 3 (Biodex Medical Systems, Inc. USA) was used for measurements of IPF force. The right foot was fixed to the plate connected to the Biodex system (Figure 1). The subject was seated on an adjustable seat, and the trunk was positioned at 80 degrees flexion with the knee and the ankle at 0 degrees in the sagittal plane. The upper limbs were crossed in front of the trunk. The force output signal during IPF was digitized at 2 kHz and stored in a computer system.
Bipolar surface electrodes (diameter 10 mm, center-to-center distance 20 mm) for recording EMG signal were placed over the muscle of gastrocnemius of the right leg. Before the electrode placement, the skin surface was lightly abraded and cleansed with alcohol to reduce impedance at the skin-electrode interface below 10 kΩ. The EMG signal was amplified and digitized at 2 kHz, and stored in the computer system.
IPFs of maximal effort for 3 s (pre-IPFs) were done three times at 5 min intervals, and the most substantial value of the evoked force was adopted as maximal voluntary contraction (MVC). After 5 min rest, an IPF maintained with maximal effort (sustained IPF) was continued until the IPF force was reduced to 50% of MVC. Then the sustained IPF was stopped and immediately a trial of 3 s maximal voluntary IPF (post-IPF) was done.
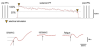
The electrodes for nerve stimulation was placed on the popliteus to the posterior tibial nerve stimulation was done with rectangular pulses of 1 ms duration with strength two times larger than the minimum strength evoking the maximal M-wave (Figure 1). The electrical stimulation was done at three different time points during the sustained IPF: at 50% of MVC on the rising phase of torque development (50% MVC); at the peak of torque (100% MVC); and at the end of the sustained IPF whose torque was decreased to 50% of MVC (Fatigue) (Figure 2). The torque evoked by electrical stimulation was determined as the height of the first peak of torque after stimulation.
The force signal of each of the pre- and post-IPFs was numerically differentiated to estimate the rate of the force development (RFD), and maximal RFD (RFDmax) was obtained as the first peak amplitude of the RFD of the MVC trial. The absolute values of the gastrocnemius EMG signals were numerically filtered with a Gaussian filter of the cutoff frequency of 4 Hz [13]. The smoothed signal of each of the preand post-IPFs was then numerically differentiated to obtain the rate of rise of the EMG signal development (RED), and the maximal RED (REDmax) of the MVC trial was obtained as the first peak amplitude of the RED [14]. The median power frequency (MdPF) of the power spectral density and the root mean square (RMS) amplitude were calculated from the EMG data for 1 s period starting at 1 s from the onset of contraction in pre- and post-IPFs. RFD and RED of the initial phase of contraction were calculated at 30, 50, 100, and 200 ms from the onset of contraction in pre- and post-IPFs. The onset of contraction was defined as the time point at which the force curve exceeded baseline moment by 2.5% of the difference between baseline moments [15].
Data analysis was done using KyPlot 5.0 (Kyens LabInc, Japan). Values are given as means ± standard error of the mean (SEM). The corresponding values of various measurements of pre- and post- the IPFs were compared using the paired t-test. The evoked torques by electrical stimulation were tested using repeated-measures analysis of variance (ANOVA). Post hoc multiple comparisons were conducted using the least significant difference method (Fisher's LSD). Statistical significance was set at the 5% level.
3. Results
The values of the duration time of Sustained IPF were 288.4±7.91 seconds (mean±SEM).
Table 1 gives the values of force and EMG measurements in pre and post-IPFs. The values of the peak and average forces in post-IPF were about 20% lower than those in pre-IPF. The values of RFDmax and REDmax were also decreased by about 30% in post-IPF, whereas no significant changes were observed in RMS and MdPF (Figure 3).

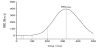
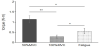
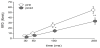
Figure 4 shows the evoked torques by electrical nerve stimulation at three-time points during the sustained IPF. The evoked torque at the 50% MVC was about 4-fold more significant than that of 100% MVC (p<0.01). The evoked torque at the fatigue point was about 2-fold larger than that of 100% MVC (p<0.05), but about one half of that of 100% MVC (p<0.05).
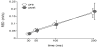
The RFD and RED at 30, 50, 100 and 200 ms from the onset of force development were increased with the time increase in both preand post-IPF (Figure 5, and Figure 6). The RFD was changed post- IPF on each time causes. The RFDs of post-IPF at 100 and 200 ms were significantly smaller than those of pre-IPF (p<0.05 and p<0.01, respectively, Figure 5). On the other hand, no significant difference was observed between the values of RED of pre- and post-IPF (Figure 6). RED of the initial phase was not significantly changed by sustained IPF. Although, REDmax was significantly changed by pre- and post IPF (Table.1). The initial phase of RED was not sufficient fatigue by sustained IPF.
4. Discussion
In this study, the values of the contractile force, EMG amplitude, and their rates of rise of plantar flexor muscles in pre- and post-IPFs were compared. The peak and average forces in post-IPF were about 20% lower than those in pre-IPF, indicating the development of muscle fatigue by the sustained IPF.
On the other hand, RED of the initial phase of contraction was not changed by sustained muscle contraction. The significant decrease of MdPF, which was thought to occur by synchronization of the motor unit, the increase of relaxation phase of motor unit and decline of discharge rate [1,16] , was not observed in this study. The decrease in force during sustained muscle contraction was thought to be due to fatigue of the peripheral, such as the depletion of energy in the muscle is mainly.
The evoked torque changed for each phase in the sustained IPF. In the initial 50% MVC, the torque increased by electrical stimulation. It was thought that the non-recruitment of motor units has existed. Evoked torque on 100% MVC was not increased by electrical stimulation. This result suggests that the almost motor units recruit by 100% MVC. The torque of 50% MVC of last of sustained IPF was increased by electrical stimulation. If it was fatigue of muscle fiber, the increase of torque induced by electrical stimulation could not be found. However, the increase of torque induced by electrical stimulation was developed.
In the primary study, the reduction of muscle force production occurred at the various factors along the pathway from the CNS through to the intramuscular contractile machinery [8]. The neural factor of muscle force decreasing was due to the decline of excitability of motor cortex and its command to motoneurons [5].
The values of RFDmax and REDmax were decreased by about 30% in post-IPF. Because the REDmax may primarily reflect changes in the activity of motor nerves supplying the muscles, this suggests a significant contribution of a neural factor in the muscle fatigue, particularly in the initial phase of contraction.
RFDmax and RFD of the initial phase of contraction had been affected in fatigue by sustained muscle contraction. The decline of muscle force production may occur at the various sites along the pathway from the CNS through to the intramuscular contractile machinery [8]. There is evidence indicating that the decline of RFD in muscle fatigue is caused by neural factors [17]. Following the previous study, we analyzed the RFDmax in the initial contraction phase [15]. The RFDs at 100 and 200 ms after the onset of contraction in pre- IPF were significantly smaller than those in post-IPF. RFD reflects activation of the nervous system, i.e., motor neurons [18,19] . These suggest that the differences of RFDmax by MVC contraction pre- and post-IPFs were due to the decrease of recruited larger motor neurons. It was thought that the neural factor of muscle force decreasing was due to the decline of excitability of motor cortex and its command to motor neurons [5].
The muscle force output, maximal rate of rise of the EMG amplitude (REDmax) of post-IPFs was lower than that of pre-IPFs. However, REDmax of onset to 200 ms by the MVC showed no significant difference between pre- and post-IPFs. It was thought that the decline of force included with the influence of neural factor by resting of large motor neurons. As for the initial phase of contraction, EMG activities immediately rose by activated in motor unit recruitment, motor unit firing rate and motor unit action potential synchronization [18]. These suggest that the decrease of REDmax was observed by the decrease of the large motor neurons activation, and it was thought that the source of fatigue was the neural factor. Although, the RED of onset to 200 ms was not changed. This result suggests that the large motor neurons recruitment were difficult after the small motor unit. As aresult, it was suggested that the RED from onset to 200ms despite the change unacceptable, the REDmax were decreased. Reduced to 50% MVC of IPF force was almost influenced by fatigue of muscle fiber on energy consumption and little influence of fatigue of CNS by restingof large motor neurons. Large motor neurons dominate type II fibers. It was thought fatigue was induced by sustained contraction. These results suggested that the activation of motor neurons was decreased by sustained IPF. Moreover, decrease of torque by sustained IPF, the rise of evoked torque due to electrical stimulation, was the decline of activation of CNS.
Competing Interests
The authors declare that they have no competing interests.