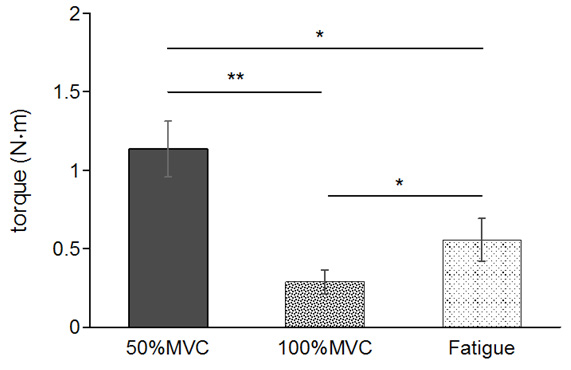
Figure 4:
Comparison of evoked torques at 50% MVC in the rising phase, the peak phase (100% MVC), and the decrease of 50% MVC condition at the end of the sustained IPF. The error bars represent the SEM. * p<.005, ** p<.001.