


1. Introduction
Bodily sensation is particularly important for activities which are involved in normal movements and the protection of the body from nociceptive stimuli. Collecting information from the various senses is impaired by peripheral neuropathies, such as stroke, physical trauma, and diabetes mellitus. The presence or absence of sensory impairment is an important factor during physical therapy and can even influence a patient’s prognosis. In fact, temporal-spatial gait parameters are significantly affected by diabetic neuropathy [1]; among individuals with peripheral neuropathy, up to 39% of those above 65 years of age and 35% of those above 55 years of age are reported to fall annually [2,3].
In peripheral neuropathies, nerve conduction velocities were used to diagnose sensory nerve disturbance. Recent investigations have elucidated the possible causes of such neurological disorders: a drop in blood supply to peripheral nerves and/or hyperglycemia toxicity may underlie impaired nerve fiber conduction. In diabetic neuropathy, superficial sensory impairment begins from the distal ends of the limbs and is characterized by dulling of vibratory and tactile sensation [4]. According to Dobretsov et al., the average median nerve conduction velocity of patients with diabetic neuropathy having sensory impairment is 53.2 m/s [5]. Clinical observation suggests that the dulling of superficial sensation is associated with a decrease in nerve conduction velocity. However, very few studies have performed a detailed analysis of the relationship between superficial sensation and sensory nerve conduction velocity; therefore, even though the decrease in nerve conduction velocity and progression of sensory impairment occur concurrently, we cannot confirm that they are causally related.
Accordingly, we reduced the conduction velocity of the median nerve afferent fibers through percutaneous cooling of the median nerve and investigated its effect on superficial sensation in the second finger, which is innervated by the median nerve.
2. Methods
2.1 Participants
Participants were ten healthy young adults (five men, five women, age = 21.4 ± 0.8 years, weight = 59.1 ± 9.5 kg, height = 168.8 ± 10.3 cm) from whom consent was obtained after they received a full explanation of the study in accordance with the Declaration of Helsinki. All trials were conducted while the participants were in a supine position with their eyes closed.
Figure 1 illustrates the experimental design. Nerve conduction velocity was measured via antegrade induction using a Neuropack meb-2208 (Nihon Koden Co.).
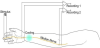
To specifically stimulate only the median nerve afferent fibers, a bipolar electrode was placed at the distal end of the third finger, where muscle tissue is absent. In order to record afferent fiber potentials, silver-plated electrodes were placed along the nerve tract of the median nerve on the ventral side of the wrist (recording electrode 1) and the anteromedial side of the elbow (recording electrode 2). The median nerve stimulus was a 3-Hz frequency square wave with a duration of 1 ms. The stimulus intensity was set to a level at which a sensory evoked potential could be clearly recorded (10 to 18 mA). Using an electrical stimulus as a trigger, the recordings were averaged over 200 recorded potentials. After completion of the trial, the conduction velocity of the afferent fibers was calculated from the distance between the negative poles of recording electrodes 1 and 2, as well as the difference in the latencies of evoked potentials. The conduction velocities before and after cooling were compared by using the Dunnett multiple comparison method (Kyplot 5.0, KyensLab Inc.).
2.2 Median nerve cooling
Median nerve cooling was performed by placing a cold pack (cold ice co., NO. 99-200) on the ventral side of the wrist, percutaneously cooling the nerve fibers (Figure 1). To prevent loss of sensation and frostbite in the cooled area, which is possible when skin temperature drops below 7oC, the temperature of the area was regularly monitored using a non-contact digital thermometer (AD-5611, A&D Co. Ltd.,); if skin temperature dropped below 7oC, the trial was immediately stopped [6].
2.3 Sensation tests
Tactile sensation was measured on the ventral side of the second finger’s distal joint using Spearman type calipers (Takei Scientific Instruments Co., Ltd.) for two-point discrimination, a pinprick stimulator (YufuItonaga Co., Ltd.), and a Semmes-Weinstein monofilament (A835-1, Sakai Medical Co., Ltd). During the twopoint discrimination test, we conducted one-point skin stimulation at intervals to confirm whether participants were truly perceiving two points. For tactile sensation measurements, quantitative sensory pinprick stimulation of a 1 g magnitude was used as a test of gross tactile perception; to assess fine tactile perception below 1 g, we used the Semmes-Weinstein monofilament. For every test, the measurement site was touched three times while the patient’s eyes were closed. The minimum value corresponding to any of the three touches felt by the participant was recorded. In the analysis of the Semmes-Weinstein monofilament test, we used the calculated force (CF): a theoretical value of pressure applied to the skin calculated from the diameter of the filament.
3. Result
3.1 Changes in nerve conduction velocity after cutaneous cooling
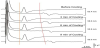
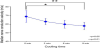
Figure 2 plots records of evoked potentials before and after cooling. The onset of the evoked potential recorded by recording electrode 2, which was placed farther from the area of cooling, was gradually delayed and showed a decrease in conduction velocity. As shown in Figure 3, the average nerve conduction velocity before cooling was 69 ± 6.71 (mean ± SD) m/s; the value dropped continuously with the cooling time, reaching 57.8 ± 4.2 m/s at 9 min after cooling. The nerve conduction velocity at 6 and 9 minutes after cooling significantly decreased relative to that measured before cooling.
3.2 Changes in superficial sensation after cutaneous cooling
After nine minutes of cooling, no changes in the two-point discrimination or pinprick pressure score were observed in any of the ten subjects tested. In the Semmes-Weinstein monofilament test, the CF values of eight subjects were unchanged, while those of two subjects were reduced to 13.9% and 40.6% of the values before cooling; the decrease suggests a sensitization to tactile perception.
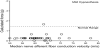
Figure 4 shows the relationship between the conduction velocity and the CF value. The dashed line represents the boundary which classifies CF values as indicating either normal or dulled tactile sensation [7]. With the exception of one measurement, the CF values remained in the normal range, regardless of the nerve conduction velocity.
4. Discussion
In this study, we estimated the sensory nerve conduction velocity by measuring the latencies of the first peak of an evoked potential; the conduction velocity was thus assumed to be that of relatively thick sensory fibers (Group A) known to transmit superficial tactile sensations [8]. The cutaneous cooling used in this study was found to decrease the afferent fiber conduction velocity, but not the superficial tactile sensation of the innervated skin. These findings contrast with observations on diabetic peripheral neuropathy, which features impairments of both conduction velocity and superficial sensation. According to a report by Fujimura et al., the average median nerve conduction velocity of diabetic patients with diabetic neuropathy syndrome is 53.2 m/s [5]; sensory impairment may occur when conduction velocity drops to approximately 50 m/s. However, the two participants whose conduction velocity was reduced to approximately 50 m/s did not lose superficial sensation sensitivity (Figure 4).
There are several possible explanations for the discrepancy. In the first place, diabetes and cooling may affect different sensory nerve groups. In terms of the diameter of nerve fibers, however, the decrease in conduction velocity is more severe as the diameter of nerve fibers becomes smaller; this would apply to both diabetes [9] and cooling [10]. Another intriguing possibility is that the sensory impairment observed in peripheral neuropathy involves elements other than sensory nerve fibers (e.g., sensory receptors). A final possibility concerns differences in the state of the nerves and the time course between the conditions: the cooling procedure used in this study is an acute manipulation, allowing the chilled nerves to remain alive; diabetic neuropathy, however, is a chronically developing disorder that may contribute to nerve degeneration [11].
5. Conclusion
This study showed that afferent fibers have a higher resistance to decreases in conduction velocity in response to cooling than was clinically assumed to be the case for peripheral neuropathy. No decrease in two-point discrimination or tactile sensation sensitivity at a conduction velocity of at least 50 m/s was observed.
Competing Interests
The authors declare that they have no competing interests.
Author Contributions
Junya Komagata: Performed the experiments, collected data, and
wrote the manuscript.
Toru Tamaki, Akihiro Ashikawa: Performed the experiments and collected data.
Ken Muramatsu: Contributed to discussion and reviewed/edited the
manuscript.