


1. Introduction
Implicit measures are intended to provide an “unedited” view of an individual’s associative learning history by revealing their initial reactions to stimuli, such as the sight of someone from a specific ethnic group. People are often unaware of their own immediate response (or “attitude”) to these stimuli and, additionally, there are social pressures that discourage certain reactions. Therefore, explicit measures, such as survey outcomes, may be unreliable or inaccurate, particularly when the survey is related to a socially sensitive subject [1-3].
There are many approaches to obtaining implicit measures. Most procedures are based on response latency (reaction time) and categorization errors, including the Go/No-Go Association Task (e.g., [4]) and the Implicit Association Test (IAT; e.g., [5]). These tests are based on the idea that the strength (or cognitive persistence) of a paired-stimulus association can be measured by participants’ response latencies in time-pressured categorization tasks. In a review of the evidence, Nosek, Hawkins, and Frazier [6] found that implicit measures tend to be better predictors of behavior than explicit measures where there is risk of social censure.
The Implicit Relational Assessment Procedure (IRAP) is a latencybased approach to implicit measurement with some advantages over the IAT [7]; its development was informed by Relational Frame Theory (RFT), a behavioral account of language and cognition [8]. In the IRAP, participants respond to a series of paired stimuli (e.g., words and images) by selecting dichotomous response options to indicate whether a pair of stimuli is consistent with an experimenter-specified rule. The participants are pressured to respond both quickly and accurately (i.e., corresponding to the given rule); they are exposed to the same number of rule-appropriate and rule-inappropriate stimulus pairs under two opposite rule conditions. Difference (i.e., D-IRAP) scores, the primary dependent measure of the IRAP, are calculated from response latencies under opposite-rule conditions.
The Relational Elaboration and Coherence (REC) model explains that implicit-measure procedures, particularly those that rely upon response latency, are revealing “brief and immediate relational responses” (BIRRs) that are learned through multiple exemplar training in which certain stimuli are directly associated (e.g., “obese is unhealthy; unhealthy is bad”), so they occur within a few seconds and precede “extended and elaborated relational responses (EERRs)” ([9], p.102). Though there is no distinct boundary between BIRRs and EERRs, the REC model proposes that EERRs take longer to occur than BIRRs because they are produced as a result of the activation of larger, more complex, and indirectly conditioned relational networks, including those involved in settling on a socially appropriate or experiment-appropriate response, which may not correspond with the more directly conditioned response [9-11].The person is “covertly doing more” if they find stimuli, such as “a hairy worm is pleasant,” to be inconsistent with their historically coherent relational network but are asked to respond in the affirmative ([12], p. 111).
Recently, researchers have proposed the DAARRE (differential arbitrarily applicable relational responding effects) model, which aims to clarify the role of three key factors that are likely to affect responding in IRAP trials: contextual control of relational responses associated with the labels and target stimuli, stimulus control by the label and target stimuli, and functions associated with response options (e.g., true, false) [13-17]. The scores applied to each factor can be summed up to predict differences in D-IRAP scores associated with each trial type.
Because the goal with implicit measurement is to obtain an unedited response from the individual, the degree to which responses can be edited prior to emission, known as “fake-ability,” in an implicitmeasures task is an important consideration. With specific training, participants can learn to “fake” the IRAP and other implicit-measures tasks. Without such training, response manipulation is still possible, but only to a limited extent [18,19].
Another potential limitation of implicit measures tasks is attrition. IRAP participants must meet performance criteria during practice trials, such as a median response latency of 2,000 ms or less, with at least 80% response accuracy, to proceed to test trials. Without latency and accuracy requirements in place, participants could respond slowly enough that editing of responses for social acceptability would be possible, or participants could respond too quickly, without regard to the stimuli, thereby defeating the purpose of the implicit measure. Hughes and Barnes-Holmes [9] found a mean attrition rate of approximately 20% due to participants failing to meet the performance criteria in 18 reviewed studies (pp. 116-117). Attrition from implicit measures tasks is problematic because it may result in systematic biases in the resulting data (i.e., only data from those who are “motivated” or capable of passing the task are included in the final analysis). Additionally, attrition is one issue that limits the usefulness of implicit measures for evaluating the attitudes of individuals rather than groups.
We hypothesized that offering a monetary incentive for meeting latency and accuracy criteria in the IRAP would reduce the probability that participants would alter their responses to correspond with socially acceptable attitudes and that the incentive would reduce attrition resulting from failure to meet performance criteria. Money is commonly used to promote research participation or improve work performance [20]. When the performance of adolescents is incentivized, their number of errors and response latency is negatively correlated with the amount of monetary reward [21,22]. In addition, increasing monetary incentives appears to improve both speed and accuracy during cognitively demanding tasks (e.g. [23-26]). To our knowledge, no evaluation of monetary incentives on implicit measures outcomes has been published.
We selected an anti-fat/pro-slim IRAP task. The “thin ideal” body image in many cultures is linked to eating disorders and negative self-evaluations for individuals who do not match the ideal, even for those who are healthy, and these individuals may also be victims of discrimination [27,28]. Researchers have applied a variety of implicit measures procedures to estimate bodyweight bias, including the IAT and the IRAP (e.g. [29-35]).
Roddy et al. [34] compared the IRAP and the IAT for evaluating bodyweight bias. With “normal-weight” stimuli, participants responded faster in the bias-consistent (anti-fat/pro-slim) trials, suggesting that the participants had a pro-slim bias. However, participants did not display a difference in their response latencies on consistent and inconsistent trials with “fat” stimuli, suggesting that the participants had neither a pro- nor an anti-fat bias. Although Roddy et al. [34] were interested in attitudes toward fat and slim people, their results may not be indicative of attitudes toward slim people because “normal-weight” (rather than under-weight or “slim”) picture stimuli were used. Additionally, the facial features of the people in the upperbody photos were distinguishable. Therefore, stimuli irrelevant to bodyweight might have influenced the outcomes.
Expósito et al. [31] used the IRAP to investigate the bodyweight bias of female university students using the same procedure as Roddy et al. [34], but with pictures of overweight and underweight individuals with the models’ faces blurred. With “slim” stimuli, participants responded faster in the bias-consistent (anti-fat/pro-slim) trials, suggesting that the participants had a pro-slim bias. With “fat” stimuli, response latencies did not differ, on average, between consistent (antifat/ pro-slim) and inconsistent (pro-fat/anti-slim) rule conditions with negative stimuli (i.e., the word “unpleasant”), but response latencies did differ with positive stimuli in the “pro-fat” direction, suggesting that participants had a pro-fat bias.
In the present study, we administered an IRAP for evaluation of bodyweight bias with the primary purpose of evaluating the influence of a performance-based monetary incentive (the independent variable) on IRAP outcomes (the dependent variables). We offered the incentive to participants in the experimental group but not to those in the control group. We hypothesized that participants in the experimental group would produce D-IRAP scores indicative of less appropriate social attitudes (i.e., greater “anti-fat” bias) and that they would perform with higher accuracy and lower latency, resulting in lower attrition, relative to participants in the control group.
2. Method
2.1 Participants
Eighty-two University of Waikato students from 17-51 years of age (M = 23 years, 95% CI [21.72, 25.04]) participated. The majority of the 77% female and 23% male participants were majoring in psychology. Of the participants, 32% had previous exposure to other IRAP studies.
2.2 Materials
We used Open Source Implicit Relational Assessment Procedure (IRAP) software, available online (https://doi.org/10.17605/OSF.IO/KG2Q8), for all experimental procedures. On each trial, the software displayed 1 of 12 (6 overweight [3 male and 3 female] and 6 slim [3 male and 3 female]) silhouette picture stimuli at the top of the screen. The images were obtained from Open Science Framework (OSF; see [36]). Each image was 235 x 300 px, the same size as the pictures used by Roddy et al. [34]. Below the image, 1 of 12 adjectives appeared simultaneously. The six “positive” adjectives were “Desirable”, “Active”, “Disciplined”, “Attractive”, “Healthy”, and “Good”. The six “negative” adjectives were “Undesirable”, “Lazy”, “Sloppy”, “Ugly”, “Ill”, and “Bad”. These were the same adjectives used by Roddy et al. [34]. In the lower left and right corners of the screen, the software displayed “PRESS ‘d’ for [True/False]” and “PRESS ‘k’ for [True/False],” with the position of the words “True” and “False” randomly assigned to the left or right on each trial.
Prior to each block of 24 trials, the program displayed the message “answer as if you are anti-fat and pro-slim” (consistent block) or “answer as if you are pro-fat and anti-slim” (inconsistent block) in the center of the screen and, below the message, “press the spacebar to proceed”. The 24 trials contained four trial types, slim-positive (“slim” stimuli and “positive” adjectives), slim-negative, fat-positive, and fatnegative. The specific stimuli corresponding with each of the four trial types were randomly selected on each trial. During the practice phase, participants completed pairs of consistent and inconsistent blocks of trials until they met criteria of 80% accuracy and a median latency less than 2000 ms or until they had completed three pairs of blocks. If they did not satisfy the criteria, we allowed them to continue to the test phase but did not include their data in the final data analysis. In the test phase, all participants completed an additional three pairs of consistent and inconsistent blocks in alternating order.
On each trial, the participants were presented with the trial stimuli and, if a response did not occur within 2000ms, latency feedback in the form a red exclamation mark (“!”) appeared in the center of the screen, but the participant could respond at any time after the “!” had appeared. The presentation of latency feedback was programmed to start from the second pair of blocks in the practice phase. In all trials, if an incorrect response (i.e., a response that did not correspond with the rule for that block) occurred, a red “X” appeared in the center of the screen, and the trial stimuli remained in place until the correct response occurred. The inter-trial interval was 400ms.
2.3 Procedure
The University of Waikato School of Psychology Research and Ethics Committee approved the research (Protocol 16:12). The 82 participants were randomly assigned to two groups, a control and experimental (“incentive”) group with equal numbers in each group. Participants completed the experimental procedure individually in a small room equipped with a desktop computer and a monitor (1920 x 1080 resolution) and two desks (one for the participant and the other for the experimenter who was present in the room during the entire experiment).
We used two types of IRAP sequences to control for order bias with participants randomly assigned to one of two sub-groups within each of the incentive and control groups. One subgroup started with anti-fat/ pro-slim (consistent) trials and the other subgroup started with pro-fat/anti-slim (inconsistent) trials. Before commencing the IRAP task, participants were presented with a set of instructions (available upon request).
For the incentive group, all sequences and procedures were the same as for the control group, except that the experimenter made the following statement (orally) to the incentive group and not to the control group:
If you meet the criteria, which require you to respond accurately and quickly during the practice phase and maintain good performance until the end of the IRAP test, you will earn a $20 voucher in addition to the participation reward of either course credits or entry into a draw to win a $20 iTunes voucher. The extra $20 voucher is a part of this experimental design, so you were not informed about it at the beginning of the experiment briefing. Even if you do not meet the criteria, you can still obtain the participation rewards. Would you still like to continue?
Participants in both groups were offered an incentive for participation in the study, either course credits or an entry in a draw to win a $20 (NZD) iTunes® voucher, that was not dependent upon their performance in the experimental task. Only the experimental group was offered the additional performance-contingent incentive.
2.4 Data analysis
The IRAP software recorded response latency as elapsed time (in ms) on trials with correct responses. Latency was recorded from the onset of a stimulus presentation (e.g., a combination of a silhouette image and a target label of either a positive or negative word) until the participant pressed the correct key (i.e., either the “d” or “k” key).
Response latencies were used to calculate the D-IRAP score (see [37], p. 399 for the specific calculation). If there was no difference in response latency on a certain trial type (for example, fat-positive) between consistent (anti-fat) and inconsistent (pro-fat) rule conditions, a D-IRAP score of zero was generated. Positive D-IRAP scores for each trial type are indicative of anti-fat/pro-slim bias; negative D-IRAP scores are indicative of pro-fat/anti-slim bias. Scores between 0.6 and 0.8 are indicative of a large effect [37,38].
3. Results
3.1 Sequence effects and reliability
We conducted a preliminary analysis of the block-sequence effect on the group of participants exposed to an anti-fat & pro-slim trial first and on the group exposed to a pro-fat & anti-slim trial first (combined across both incentive and control groups). The analysis showed no significant effect of order on D-IRAP scores, t(318) = -.54, p = .37. We calculated internal consistency for all D-IRAP scores using a split-half method in which the D-scores for odd- and even-numbered trials are compared. Spearman-Brown reliability for the D-IRAP scores showed a moderate correlation (r = .46, p< .001).
3.2 Accuracy
Participants in the incentive group made fewer mistakes (M = 11.76, 95% CI [10.26, 13.26]) than those in the control group (M = 13.56, 95% CI [11.48, 15.65]), but this difference was not significant, t(80) = 1.38, p = .17, d = .30, 95% CI [-.13, .74]. This difference is somewhere between a small and medium effect size according to Cohen’s conventions [38].
3.3 Latency
Based on independent t-tests, there was no significant difference in the number of responses occurring before the 2000-ms-latency criterion for the control group, (M = 120.66, 95% CI [117.87, 123.45]) compared to the incentive group, (M = 122.46, 95% CI [120.52, 124.40]), t(71.32) = 1.04, p = .30, d = .23, 95% CI [-.21, .66].
3.4 Attrition
We set the passing criteria at a maximum median latency of 2000ms and a minimum of 80% correct in each block. In the incentive group, only one person failed to pass the IRAP performance criteria during the practice phase (97.5% pass rate). Five participants in the control group failed to pass (87.8% pass rate). We were unable to run a chisquare test to check whether this difference was significant because of the extremely low attrition rates in both groups (see [39]).
3.5 D-IRAP scores
As indicated in Figure 1, the mean D-IRAP scores from the incentive and control groups were consistent in slim-positive and slim-negative trials but diverged in fat-positive and fat-negative trial types. A strong pro-slim IRAP effect was observed for the slimpositive trial type in both groups. Participants were faster to respond “True” in consistent (pro-slim) blocks than to respond “False” in inconsistent (anti-slim) blocks when presented with slim silhouette images and positive words. A strong pro-slim effect was also observed for the slim-negative trial type. Participants were faster to respond “False” in consistent (pro-slim) blocks than “True” in inconsistent (anti-slim) blocks when presented with slim silhouette images and negative words. The D-IRAP scores for the slim-positive words were the same for both groups .49, 95% CI [.36, .62]. A one-sample t-test indicated that the slim-positive D-IRAP trial scores were significantly different from zero for the control group, t(40) = 7.34, p < .001, and for the incentive group, t(40) = 7.47, p < .001. The D-IRAP score for the slim-negative words as .23, 95% CI [.11, .36] for the control group and .24, 95% CI [.14, .34] for the incentive group. A one-sample t-test indicated that the slim-negative D-IRAP trial scores were significantly different from zero for the control group, t(40) = 3.76, p < .001, and for the incentive group, t(40) = 4.59, p < .001.
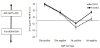
A small pro-fat IRAP effect was observed for the fat-positive trial type. The control group was faster to respond “True” in inconsistent (pro-fat) blocks than to respond “False” in consistent (anti-fat) blocks when presented with fat silhouette images and positive words. This pro-fat effect, however, was larger in the control group. The mean D-IRAP score for the fat-positive trials was -.18, 95% CI [-.29, -.06] for the control group and -.09, 95% CI [-.19, -.01] for the incentive group. A one-sample t-test indicated that the fat-positive D-IRAP trial scores were significantly different from zero for the control group, t(40) = -3.02, p < .01, but non-significant for the incentive group, t(40) = -1.67 p = .10. A moderate anti-fat bias was observed for the fatnegative trial type in the incentive group. Participants in the incentive group were much faster to respond “True” in consistent (anti-fat) blocks than to respond “False” in inconsistent (pro-fat) blocks when presented with fat silhouette images and negative words. However, we observed a near-zero anti-fat bias for the control group. The mean D-IRAP score for the fat-negative trials was .05, 95% CI [-.05, .15] for the control group and .25, 95% CI [.16, .35] for the incentive group. A one-sample t-test indicated that the fat-positive D-IRAP trial scores were significantly different from zero for the incentive group, t(40) = 5.31, p < .001, but not significantly different from zero for the control group, t(40) = 1.02, p =32.
We conducted a two-way mixed ANOVA to evaluate the influence of group membership on D-IRAP scores in fat-positive and fatnegative trial types. A significant main effect of group membership on D-IRAP scores, F(1, 80) = 7.71, p = .007, Ƞp2 = .09, indicated that the incentive shifted responding in the anti-fat direction. A significant main effect of trial type, F(1, 80) = 28.6, p< .001, Ƞp2 = .26, indicated that, overall, D-IRAP scores associated with the fat-negative trial type were more anti-fat than those associated with the fat-positive trial type. The interaction between the two factors was not significant, F(1,80) = 1.12, p = .29, Ƞp2 = .01. All the assumptions of the statistical tests were met. Box’s test showed homogeneity of covariance matrices and Levene’s test showed that the variances were equal for fat-positive trial type, F(1, 80) = .08, p = .78, and for fat-negative trial type, F(1, 80) = .33, p = .75. We did not include slim trial types in our statistical analysis because it was clear that there were no meaningful differences between the two groups with respect to the observed values from these trial types.
4. Discussion
Our results did not support our hypothesis that the incentive group would perform with higher accuracy than the control group. Although mean accuracy and mean number of occurrences of latency less than 2000ms were higher for the incentive group compared to the control group, this difference was not significant. The effect size was small to medium, according to Cohen’s conventions [38], so it may be that we had insufficient power to detect differences in this case. Thus, we recommend that future researchers investigate the effect of reinforcement on accuracy and latency measures in IRAP tasks with larger sample sizes.
Despite the fact that we were unable to perform a statistical test on the difference in attrition rate, we tentatively suggest that the attrition rate was reduced by the incentive. The attrition rate for the control group was somewhat lower than the attrition commonly observed in IRAP studies, including the two studies upon which we modeled our experiment, despite our stricter criteria [31,34]. The fact that many of the participants had previous experience with the IRAP may have contributed to the low attrition rate, as there is some evidence that experience with the IRAP can lead to better performance in subsequent IRAP participation [13,40]. However, the incentive in the present study appeared to further lower attrition.
In line with our hypothesis, the incentive group’s D-IRAP scores were shifted in the anti-fat/pro-slim direction in comparison to the control group’s scores. However, we only observed this effect in fat-positive and fat-negative trials, not in the trials involving “slim” stimuli. It is possible that judgements associated with “slim” may not be as socially sensitive as judgements associated with “fat” in the cultures with which our participants were associated. Therefore, there may have been greater correspondence between EERRs and BIRRs associated with “slim” stimuli than with “fat” stimuli. In this case, and in any case in which participants are responding to stimuli that are not associated with a high possibility of social censure, we would not expect an intervention that maximizes BIRRs and minimizes EERRs to produce different outcomes from explicit measures.
Because we collected no socially relevant behavioral outcome measures, for example, the probability of discrimination against people who are overweight, we cannot make definite conclusions about the effectiveness of the monetary incentive to improv access to BIRRs or “implicit attitudes.” For many researchers, the improvements in attrition rate alone may be reason enough to incentivize performance in the IRAP or other implicit-measure tests, but there appears to be some evidence that the validity of the test may also increase with incentivized performance. Additional research on this topic is required.
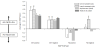
Our results can be compared directly with those of Roddy et al. [34] and Expósito et al. [31], which were obtained under similar conditions to our study. Consistent with these two studies, we observed a clear pro-slim bias (Figure 2). D-IRAP scores for each trial type indicated a similar attitudinal direction across the studies. However, on trials involving “fat” stimuli, there was more variability between the studies. We observed the largest anti-fat bias across all studies in our incentive group in the fat-negative trials.
We used silhouette images to eliminate ‘noise’ factors from compound stimuli (such as smiling faces in photographic images) that could evoke wider ranges of responses among participants. Although we did not experimentally evaluate the effect of this modification to the procedure, selection of stimuli without extraneous features should help to isolate the feature under study. Additional research such as analysis of stimulus functions through application of the DAARE model (e.g., [13,14]) may help to elucidate the influences of extraneous features on outcomes of research associated with attitudes toward bodyweight. It would also be useful to investigate attitudes toward body size in different cultural contexts, including cultures in which there is not a “thin ideal” for body size.
5. Conclusion
We tentatively suggest that delivering a monetary incentive for meeting accuracy and latency criteria in an implicit-measure task may lower attrition rate. Additionally, the incentive appeared to push responses associated with “fat” stimuli in the socially inappropriate direction, suggesting that implicit measures obtained under conditions of incentivized performance may be more indicative of “implicit attitudes” than measures obtained without incentives. However, further research is required to verify this finding by collecting relevant behavioral outcome measures.
Competing Interests
The authors declare that they have no competing interests.