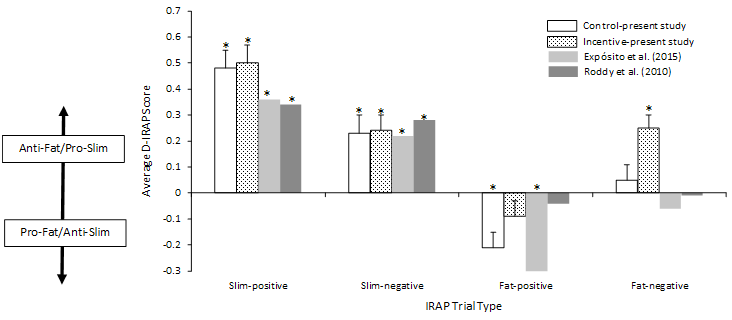
Figure 2: Comparisons of D-IRAP scores from the two groups in the present study with previous IRAP studies on anti-fat/pro-slim bias. Positive scores indicate a pro-slim/anti-fat attitude; negative scores indicate a pro-fat/anti-slim attitude. Asterisks indicate that a score is significantly different from zero (α = .05).