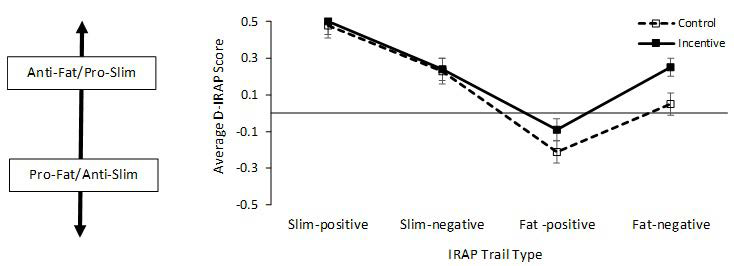
Figure 1:
Average D-IRAP scores between control and incentive groups across the four trial types. The error bars represent the standard error of the mean.