


1. Introduction
The United States continues to become increasingly ethnically diverse. It is projected that by 2025, immigrants and their descendants will be the fastest growing segment of the U.S. population [1] . Currently, it is estimated that more than 3.5% of U.S. children are foreign-born and more than 20% of U.S. born children have at least one foreign-born parent [2] . More than 19.3 million people emigrated from African countries, primarily Sudan, Somalia, and Ethiopia; of those emigrants, approximately 2.3 million were classified as refugees by the United Nations [3] .
Studies have shown that upon arrival to the U.S., immigrants have a healthier cardiovascular risk profile and longer life expectancy than the general U.S. population [4,5]. Overtime, however, their cardiovascular risk profile exceeds the general U.S. population levels [6] . This health decline may be partly attributed to a reduction in physical activity after immigration, leading to increased rates of obesity and related diseases. Adult immigrants to the U.S. from developing countries are consistently found to have low levels of physical activity (i.e., sedentary lifestyle) and report their activity levels, particularly walking and running, decline following immigration to the U.S. [7] . Declines in activity levels are attributed to new environmental challenges, including safety, transportation, expense, and cold weather [8,9].
There is evidence that rates of obesity also increase dramatically among immigrant children. Hervey and colleagues observed that among new immigrant children to the U.S., BMI increased within the first two years of arrival; 57% of underweight children became normal weight, while children who were at risk of overweight or obesity had an odds ratio of 18.9 of becoming overweight or obese [10] . In another cohort study, the prevalence of obesity among new immigrant children increased sharply from 34% at arrival to 49% at 6-years follow up [11] . This increase has been largely attributed to transitioning to a Western diet high in fat and sugar [12] ; however, decreased physical activity level is likely a significant factor.
Very little is currently known about physical activity among children of African immigrants to the U.S. The U.S. Department of Health and Human Services provides data on childhood physical activity for diverse racial and ethnic groups; however, this data does not reflect immigrant children who may experience greater barriers to physical activity [13,14]. The limited published research describing immigrant children indicates lower levels of physical activity among foreign-born children when compared to their non-immigrant counterparts. As with adults, their amount of physical activity decreases as the length of time since arrival to the U.S. increases [15] . However, these studies were largely based on proxy respondents, did not include direct measures of activity and combineddata from multiple ethnic groups-; therefore, they may not best reflect the true activity any specific ethnic group.
Accurately quantifying patterns and levels of physical activity among immigrant children, particularly those from developing countries, is important in order to identify whether lack of activity is a concern that needs to be specifically addressed in future interventions. The purpose of this current research project is to describe the physical activity patterns and levels, using both selfreported and direct measures, among Sudanese children and adolescents in a Midwest Metropolitan area. Specifically, we describe the 1) overall physical activity levels; 2) proportion of children who meet current activity recommendations; 3) timing of activity in relation to typical school hours; and 4) whether activity levels differ by gender and are related to obesity.
For the purpose of coherence within this paper, a single and unified definition of the phenomenon was utilized. Workplace bullying involves the continuous perpetration of negative acts on a victim accruing from an imbalance of power between the perpetrator and victim, often resulting in physical and psychological harm [12] .
2. Methods
2.1 Design and sample
This study was part of a larger study describing obesity phenotypes among Sudanese immigrants and refugee families residing in Eastern Iowa. The primary study was a cross-sectional study of 31 Sudanese families and included 58 adults and 64 children over the age of 5-years. The Sudanese Society Directory of all community members served as a sampling frame for the primary study. Families with children over the age of 5-years were identified from the directory with the help of community leaders. Families were initially contacted by a key informant then,with their permission, were contacted by a member of the research team. A total of 47 families were contacted, of which 42 families met the inclusion criteria of having at least one child between the age of 5- and 18-years; 31 families completed the study for a response rate of 73.8%.
2.2 Measures
Physical activity was evaluated using self-reported questionnaires and pedometers. For the self-reported measure a modified version of the self-report Physical Activity Questionnaire for Adolescents and Children (PAQ A and C) was used. The PAQ A and C is designed to measure the frequency, intensity, and duration of physical activity of a child over the previous seven days. Activities include organized sports and recreational physical activity, as well as sedentary behaviors [16] . The modified version (PAQ) has good internal consistency and reliability; among children from the Midwest the validity correlation coefficients between the revised PAQ and the activity monitor were moderate (rho = 0.56 and 0.63). The Cronbach coefficient alpha measuring the internal consistency of the PAQ ranged from 0.72 to 0.88, and the test-retest reliability measured within one week was 0.77 [17] .
Physical activity was measured directly using the Omron HJ-720 IT pedometer. Omron HJ-720 IT pedometer can be worn in a pocket, around the neck, or on a belt loop. The Omron HJ-720 IT allows user characteristics (i.e., age, height, weight, and gender) to be entered, and the output includes total steps, aerobic steps (accumulated in continuous bouts of 10 minutes or longer), minutes of aerobic steps, amount of calories burned, and distance traveled. This pedometer can store data in one-hour epochs for a 7-day recall on the pedometer display and has a 41-day storable memory [18,19]. Pedometers, in general, have good reliability and validity among children; reliability was reported in the range of ICC= 0.51 to 0.92, and inter-pedometer measures ranged from 0.73 to 0.80 [19] . The convergent validity of pedometers ranged from 0.47 to 0.99 against accelerometers and from (0.49 to 0.83) compared to heart rate monitors [20] .
Weight was measured to the closest 0.1 pound by using an electronic weight scale (Tanitia Corp) with minimal clothing and without shoes. Accuracy of the scale was monitored daily with 50 pound calibration weights. Height was measured to the closest 0.1 inch using a wall-mounted stadiometer. BMI was calculated as weight (kg)/ height (cm)2. BMI percentile was classified, according to Center for Disease Control and Prevention (CDC) standards, into four groups: underweight (BMI percentile < 5), normal (BMI percentile > 5 to < 85), overweight (BMI percentile >85), and obese (BMI percentile > 95). Body fat percent was measured using dual energy X ray absorptiometry (DXA; GE Lunar Prodigy, Madison, WI, U.S.). For body composition scans, subjects laid flat on the scan table and were positioned visually using the computer monitor [21] . All scans were performed by a trained technician. Body fat percent (BF %) was computed using the child’s actual fat and lean mass BF%= ( (Fat mass (g))/((Fat mass (g)+lean mass(g) )). In agreement with other studies, high body fat was defined as BF% >25 for boys and > 32 for girls [22] .
All data, including body composition and self-reported activity data, were collected in the College of Nursing Research Suite (The University of Iowa). Participants over 13-years of age were given written consent forms, and children younger than 13-years of age were given assent forms. Consent documents were presented in both Arabic and English. Families were compensated for participation. Pedometers were calibrated for weight, time and stride length prior to distribution. Stride length was calculated by asking the children to walk ten normal strides. The total distance walked from start to end was measured in inches and stride length was then calculated by dividing the total distance by 10. Children were instructed to wear pedometers during their waking hours for total of 7 days. The study was approved by The University of Iowa Institutional Review Board.
2.3 Analytical strategy
Means and standard deviations (SD) were used to describe normally distributed data (e.g. height, weight). Non- normally distributed data were described using medians and ranges or were categorized. Proportions were used to describe categorical data. We used the T-tests to examine the difference between the means for continuous variables and Chi Square with Fisher exact test for categorical variables. Data were analyzed using Statistical Analysis System Software (SAS, version 9.3).
Data from PAQ were categorized into two groups: active and inactive. 'Active' was defined as a score of 13.8 or greater on the sum of the PAQ questions related to activity (i.e., questions 1, 3, 5-8, and 14). These questions address the types of activities the children often participated in, the time of the activity (morning, afternoon, or evenings), the number of times children engaged in the physical activity during the previous week, and the children's perception of their physical activity levels during free time in the last 7 days. 'Inactive' was defined as having a mean score of 3 or lower on the sum of the PAQ questions related to watching TV, playing video games, and playing electronic games (questions 9 -11) [17] . These questions address the number of hours per day the children watched TV, played video games, and played computer or electronic games during the previous week.
Based on pedometer data children were classified as active and inactive. For boys under age 12, active was defined as having an average of 12,000 steps or more per day. For boys 12 years and older and all girls, active was defined as at least 10,000 steps per day [23] . The CDC recommends that all children participate in a minimum level of moderate to vigorous physical activity at least 60 minutes a day. In order to determine the proportion of children who met this recommendation, considered either the self-report or step data. For the self-report data we considered the type of activity (ie basketball, running) and the amount of time spent doing the activity each week. For the step data we used the CDC classification where moderate to vigorous activity is equivalent to 13,000 steps per day for boys, 11,000 steps per day for girls under 12and 10,000 steps per day for boys and girls 12 and over [13] . To be included in the data analysis,children had to have worn their pedometers for at least 8 hours a day for a minimum of 3 days, and must have recorded more than 2500 steps daily as suggested by Tudor-lock and colleagues [23] . To determine when the majority of activity had occurred, the timing of activity was grouped according to whether it occurred during typical school hours, evenings, weekends, or free time.
3. Results
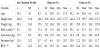
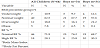
Sixty-four children (33 girls, 31 boys) completed the study. The average age was 10.1 ± 3.3 years, with no significant difference between boys and girls. Girls had a significantly higher fat mass mean than boys (p = 0.04) (Table 1). Using the BMI percentiles 17 children (26.5%) were identified as overweight or obese; girls more often than boys (30% vs., 23%, p = 0.31). Usingthe BF%18 of the Sudanese children (8 boys and 10 girls) were identified as having high BF% (Table 2).
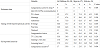
The pedometers were worn by 54 children (84.4%). On average, the children wore the pedometers for 5.8 days and averaged 7359 steps per day.There was no significant difference in average steps per day between boys (7631.4) and girls (7044) (p=0.37).However, boys averaged significantly more aerobic steps (784.6) per day, than girls (169.4) (P<0.05) (Table 3). When children were classified as inactive or active based on the pedometer data, only three (5.6%) children (all girls) were classified as active (Table 4).Applying the CDC recommendation of moderate and vigorous physical activity (as detailed in the method section), all Sudanese childrenwere classified as inactive based on their pedometer data. According to the PAQ data, 36% (n = 23) of the children were inactive (active sum score < 13.8), and 22% (n = 14) were identified as active,A significantly higher proportion of girls were categorized as inactive as compared to the boys (48.4%, V.S. 24.2%, P=0.006) (Table 4).

4. Discussion
The Sudanese children in our study had very low levels of physical activity. No child met the CDC recommended activity level of 60-minutes or more of moderate-to-vigorous physical activity daily including 3- or more days per week of vigorous aerobic exercise, resistance exercise, and weight-loading activities. Less than 6% of the children were labeled as active based on step data and only 22 % were active according to their self-report [13] .By comparison, a recent Canadian study showed that 11% of new immigrants' children met CDC physical activity recommendations (i.e., 60-minutes of moderate-to-vigorous physical activity, 7-days per week) [24] . Data from The National Health and Nutrition Examination Survey (NHANES) indicates approximately 25% of U.S. born children meet the minimum CDC recommendations [25] .In a recent study of American high school children, 29% of high school children participated in at least 60 minutes per day of physical activity, girls are twice more likely to meet the CDC recommendation of 60 minutes of physical activity a day than boys (36.6% vs 17.7 %) [26] .
Consistent with the low level of physical activity among Sudanese children is their high level of sedentary, screen-related activities. We observed that 57% of Sudanese children spent more than 2-3 hours of their free time everyday watching TV, playing video games, playing electronic games, and on computer screens. This is substantially greater than the 46.5 % reported by all American children regardless of ethnicity and gender [27] and much more that the 22.5 % of immigrant children reporting high levels of sedentary behaviors[28] . This high level of screen-time and low physical activity is concerning given the role activity plays in the prevention of obesity, cardiovascular and metabolic diseases.
We did not systematically collect information regarding barriers to physical activity; therefore, the reasons for our observed low physical activity levels are not fully understood. However, anecdotal comments from children and their parents indicate physical environmental factors may pose barriers. They noted that there were no facilities available within walking distance from their neighborhood for the children to play or to engage in sports activities. In addition, public transportation to and from recreation facilities in the area was not available. These barriers are not uncommon for new immigrants and refugees; other studies suggested that transportation, poverty, neighborhood safety and lack of resources were among the major barriers reported by Somali youth and Sudanese adults [29,7]. There is some further evidence that time spent in the new country and the children's ethnicity might be key determinant factors of physical activity. Kukaswadia and colleagues observed that as the time in the new country increased, the level of physical activity decreased with an odd ratio of 0.62 [24] . Given our exceptionally low levels of physical activity in our study, we were not able to confirm our refute that noteworthy finding; however, exploring potential environmental factors contributing to lower physical activity must a priority of future research in order to optimally direct interventions.
Concerning the timing of activity, it appears, from our data, that physical education classes were an important source of activity for the Sudanese children in our study. This observation has important policy implications given the trend toward reducing physical education requirements in school. Children in our study were least active on weekends. This observation is consistent with previous research that suggests physical activity levels and intensity significantly decrease during the weekends [30,31]. For example, data from National Institute of Health (NIH) of physical activity among children concluded that 31% of American children met the CDC recommendation of physical activity during the weekdays; however, only 17% met the recommended level of physical activity during the weekends [32] . Sedentary life style during the weekends, for the Sudanese children, may partially explained by the fact that most children attend weekend school. Unfortunately, according to the children and parents, the weekend school does not have physical education and sport as part of the curriculum.
Our observation that boys were more active than girls is consistent with other research findings [33] . The gender difference in physical activity is obvious across age, ethnic and racial groups. The World Health Organization Europe regional office report for 2009/2010 showed that boys at ages 11, 13, and 15 years were more active than age-matched girls [34] . In addition, NHANES study of the physical activity of American children concluded that among all children age 6- to 19- years, boys spent more minutes per day engaged in moderate-to-vigorous physical activity (63.8 minutes per day) than girls (44.4 minutes per day) [35] .
The gender difference in activity among the Sudanese children in our study may be attributed to cultural and religious factors [29] . All of the families were Muslim and followed cultural practices that discourage girls from wearing tight sport clothes in public and observe gender separation (i.e., older girls are not allowed to play with boys). These factors may limit girls' participation in athletic and/or physically active recreation.
In this study, we reported that 26.6% of the Sudanese children were overweight or obese according to their BMI percentiles, which is lower than the rate reported in American-born children and adolescents (31.8%), but similar to the rate of other Sudanese children who immigrated to Canada (29%) [23] . When BF% was used as an indicator of obesity, obesity was more prevalent among the Sudanese children with 25.8% of the boys and 30.3% of the girls having a high BF%. This is higher than the BF% determined obesity prevalence of 19% among U.S. boys and 20% among U.S. girls [36] . Because BMI under represents true obesity in persons with low muscle mass, it is possible that Sudanese children have lower muscle mass than U.S. children and should be studied further.
The association between obesity and physical activity is complex, however there is sufficient significant evidence to suggest a correlation between physical inactivity (particularly TV watching and screen time) and obesity [37,38]. In this study, we investigate the relationship between obesity and levels of physical activity; we observed that children who reported an average of more than 2-hours of screentime were more likely to be in the obese/overweight or in the high BF % group. Our findings are consistent with other studies that show association between screen time (i.e., television and computer time) and an increased risk of being overweight (17%–44% increased risk) or obese (10%–61%) [39] .
Improving health through daily physical activity is both a national health goal and public health challenge [40] . Findings of this study can inform public health nurses, policy makers and other health care professionals. Nurses play a critical role in advising and advocating for specific population groups, especially minority groups, and help to implement strategies to improve and achieve the recommended levels of PA, thus improving the health status of children and youth. In addition, the knowledge gained from this study can also serve as a direct for future intervention research, and guide development for programs for other immigrant children.
Our study has many strong features including the use of both direct and indirect physical activity measures and the high response rate (78.3%) of our participants. However, it has some limitations including the small sample size. We did not describe the barriers to physical activity and challenges faced by the Sudanese children which should be a key objective of future research. However, this research describes an alarmingly low level of physical activity, a key health promotion behavior, and high level of sedentary activity among the Sudanese children in this study and supports the need to target these behaviors in future research and for public health interventions.
Competing Interests
The authors have no competing interests with the work presented in this manuscript.