


1. Introduction
Improvements in combustion efficiencies and reduction in harmful combustion emissions such as NOx, CO and particles in engines, burners, gas turbines and so on are important for our lives and the science development. It can be accomplished by measuring and controlling the important combustion parameters such as temperature and species concentration. Conventionally a thermocouple and a sampling probe have been widely used as a temperature and concentration measurement devices. However it is intrinsically a point measurement methodand it is difficult to measure temperature and concentration distributions inside the combustion chamber and exhaust with sufficient time resolution. Compared to the point measurement, combustion chamber designs and fuelling strategies can be efficiently evaluated by visualizing two dimensional(2D) temperature and concentration distributions, which have effects on complex phenomena such as knocking, combustion instability and production of pollutants in combustors. Therefore, 2D temperature and concentration distribution plays an important role for the combustion structure, the combustion efficiency and reduction of pollutants including NOx, CO and particles in engines, burners, gas turbines and so on.
Recently, tunable diode laser absorption spectroscopy (TDLAS) as a for temperature and species concentration measurement technique with high sensitivity and high response in combustion environments has been researched and applied to the actual combustors [1-12]. With these engineering developments, transient phenomena such as start-ups and load changes in engines have been gradually elucidated in various conditions [3]. This paper discusses a study of the fast response 2D temperature and concentration distribution measurement method based on the combination of TDLAS and Computed Tomographic (CT) reconstruction using absorption spectra of water vapor at 1388nm. The computed tomography tunable diode laser absorption spectroscopy (CT-TDLAS)method [13-17] was applied to engine exhausts for 2D temperature distribution measurement. Theoretical H2o absorption spectra in the 1388 nm near-infrared region calculated by the revised HITRAN database were used for temperature measurement. It is important to test the spectral parameters under high temperature conditions to evaluate quantitative measurements of temperature and species concentration. Accuracy of temperature measurement using TDLAS have also been validated to demonstrate its applicability to various types of combustor.
2. Theory
The gas temperature and species concentration measurement method using near infrared tunable diode laser absorption spectroscopy (TDLAS) was used in this research. TDLAS is a multispecies measurement technique with high sensitivity and high response by continuously scanning laser wavelengths and measuring absorption spectra of selected gases. Principle of TDLAS is based on Lambert Beer's law. When a beam of laser diode is transmittedacross the measurement area containing target gases, the strength of the permeated light is related to absorber concentration according to Lambert Beer's law. TDLAS depends on this spectroscopic principles to continuously measure temperature and species concentration of selected gases. The number density of the measured species n is related to the amount of light absorbed as in the following formula [1]:
Here, Iλ0 is the incident light intensity, Iλ the transmitted light intensity, Aλ the absorbance, ni the number density of species i, L the path length, Si,j the temperature dependent absorption line strength of the absorption line j, and Gvi,j the line broadening function.
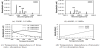
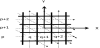
In this study H2o absorption spectra in the 1388nm near-infrared region were used for sensitive measurement of temperature in combustion environments. Theoretical H2o absorption spectra in the 1388 nm near-infrared region calculated by the HITRAN database [18] are shown in Figure 1. Three absorption lines located at 1388.135nm (#1), 1388.326nm (#2), and 1388.454nm (#3) have remarkable temperature dependence were chosen to measure temperature. It is important to use several absorption lines with different temperature dependence to reduce the temperature error induced by a CT algorism.When several laser beamsare transmitted across the measurement area containing a target gas as shown Figure 2, integrated absorbance of each laser path is related to the absorber temperature and concentration distribution along the path as in the following formula [13-17]:
Here, Aλ,p is integrated absorbance of some wavelength λ in a path, αλ,q is absorption coefficient of some wavelength λ inside a grid q on the path and is depend on temperature and density of species. Lp,q is path length inside the grid q.
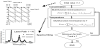
Temperature and H2o concentration at each analysis grid were determined using a multifunction minimization method [19] to minimize the spectral fitting error at 1338.0-1338.6 nm.Sets of H2o densities and temperatures at analysis grids are obtainedby the best-fitted distributions for a given measurement of Aλ, pusing the minimization procedure shown in Figure 3. A set of measured H2o absorption spectra was compared to the theoretical spectra to minimize the mean squared errors.
A polynomial noise reduction technique [14,15] was also used to reduce noises such as the effect of laser beam steering.
3. Experiment
3.1 Evaluation of temperature measurement accuracy
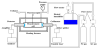
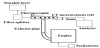
Tunable diode laser absorption spectroscopies (TDLAS) of H2o in a heated cell were used to obtain the spectroscopic data and improve temperature measurement accuracy. Figure 4 shows the experimental setup for H2o absorption spectra measurements from 300K to 800K using TDLAS. A distributed feedback(DFB)diode laser (NTT Electronics Co., NLK1E5GAAA) at 1388nm was used for obtaining H2o absorption spectra at 1388-1388.6nm.The laser was driven with diode laser controller (Thorlabs Co., TXP5004) with current source and temperature-control units (Thorlabs Co., ITC5052). Wavelength modulation was consisted of 5 kHz saw tooth ramp, which has better wavelength linearity for spectral evaluation than sinusoidal modulation, using a function generator (Wave factory Co., WF1946). The laser beam was irradiated into the measurement cell using a collimator (THORLABS Co., 50-1310-APC). The transmitted light intensities were detected by a photodiode (Hamamatsu Photonics and G8370-01). The photodiode signal was amplified by an amplifier (Stanford Research Systems, SR445A) and directly stored by a recorder (HIOKI E.E. Co., 8861 Memory High coda HD Analog16).
3.2 2D temperature measurements in engine exhausts using CTTDLAS
Figure 5 shows the outline of an experimental apparatus of the 2D temperature measurement used in this study. A DFB laser (NTT Electronics Co., NLK1E5GAAA) at 1388nm with scanning range of 0.6nm was used to measure water vapor absorption spectra. The lasers were scanned at 1kHz and these outputs were mixed using a fiber combiner. Absorption spectra were simultaneously measured to calculate the instant 2D temperature using 16 path measurement cells shown in Figure 5. The laser beam was separated by an optical fiber splitter (OPNETI CO., SMF-28e 1310nm SWBC 1×16) and the separated laser beams were irradiated into the target area by 16 collimators (THORLABS Co., 50-1310-APC). The transmitted light intensities were detected by photodiodes (Hamamatsu Photonics and G8370-01), and taken into the recorder (HIOKI E.E. Co., 8861 Memory Highcoda HD Analog16). The data acquisition rate was 500kHz (500 data points on every 1 scan of absorption spectra). Temperature in the measurement region was also measured by chromel-alumel thermocouples with a diameter of 100μm (KMT- 100-100-120).
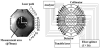
2D temperature measurements in engine exhausts using CTTDLAS were performed using a gasoline engine (FUJI HEAVY INDUSTRIES, Inc., EX13) as shown in Figure 6. The laser paths were set at the position 5mm above the outlet of the engine exhaust pipes. The diameter of 16 path measurement cell was 70mm. The diameter of the engine exhaust pipe is 22mm with thickness of 3.5mm and the pipe length was 160mm.
4. Results and Discussion
4.1 Evaluation of temperature measurement accuracy
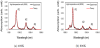
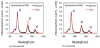
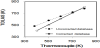
In this study three absorption lines located at 1388.135 nm (#1), 1388.326 nm (#2), and 1388.454 nm (#3) were chosen to measure temperature and H2o concentration. Absorption spectra of H2o at 1388-1388.6nm in the heated cell were measured by TDLAS. Figure 7 shows absorption spectra of H2o at 400K and 800K measured by TDLAS and they are compared with corrected theoretical spectra. The theoretical absorption spectra of H2o were revised by the measured spectralparameters, which include the set of temperature dependent absorption line strength (Si,j(T)) between 1388-1388.6nm. The corrected theoretical spectra showed good agreement with measurement results as shown Figure 8. Figure 9 shows comparison of measured temperature between TDLAS and thermocouple. Improved agreement of measured temperature between TDLAS and thermocouple was obtained using corrected spectroscopic data. It is worth to mention that the revision of the spectroscopic database leads to better temperature measurement accuracy.
4.2 2D temperature measurements in engine exhausts using CTTDLAS
CT measurement cell was applied to engine exhausts. The center of an exhaust outlet was set at the center of the CT measurement cell. The exhaust gas temperature distribution was measured by CT tunable diode laser absorption spectroscopy (CT-TDLAS). The exhaust gas temperature at X=0mm, Y=0mm was simultaneously measured by a thermocouple. Figure 10 shows the temperature history measured by the thermocouple at X=Y=0mm, averaged temperature of the laser path 6 and 8, and engine rotation speed. The engine was started at t=0s and the engine revolution was increased up to 2500 rpm. In this experiment, 1388.135 nm (#1), 1388.326 nm (#2), and 1388.454 nm (#3) absorption lines were used to measure the exhaust gas temperature. The temperature of exhausts showed sharp peaks attributed to the engine cycle. The temperature measured by the thermocouple showed the temporally delayed and smoothed time history caused by the low response. The TDLAS measurement results also showed the unburned cycles at 1100ms, 1250ms, and 2900ms, and 3000ms.
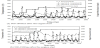
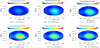
Figure 11 show the 2D temperature measurement results in engine exhausts. The results showed high temperature area at the center of the exhaust pipe and temperature distribution was a rapid change according to the engine evolution. The rapid 2D temperature measurement in engine exhaust using CT-TDLAS successfully demonstrated the merit of this technique for practical diagnostic use, including high temperature and pressure area such as internal combustion engine.
In high temperature (1000-2000 K) and pressure (1-5MPa) fields such as the temperature distribution in combustion chambers of an standard vehicle engine, the spectral parameters under these conditions to evaluate quantitative measurements of temperature and species concentration will be important.
5. Conclusion
2D Temperature detection characteristics of engine exhausts using CT tunable diode l Laser absorption spectroscopy were investigated. Based on the results of this study, the following conclusions are summarized as follows.
- Theoretical absorption spectra calculated by HITRAN database showed several discrepancies between measured and calculated spectra. The revision of the spectroscopic data leads to better measurement accuracy.
- The 2D temperature measurement method using CT tunable diode laser absorption spectroscopy was developed and successfully demonstrated to measure 2D temperature distributions in engine exhausts using 16 path measurement cells. It was demonstrated that time-resolved 2D temperatures using CT tunable diode laser absorption spectroscopy in engine exhausts was achieved for practical applications.
Competing Interests
The authors have no competing interests with the work presented in this manuscript.
Author Contributions
All authors contributed significantly to this work. Yoshihiro Deguchi proposed and conceived the study. Yoshihiro Deguchi made substantial contribution to design and guide the experiment. Takahiro Kamimoto performed the experiment, analyzed data and wrote the manuscript. All authors participated in drafting the article and revising it critically. All authors read and approved the final manuscript.