


1. Introduction
Medium-Mn steels constitute the core of the 3rd generation advanced high-strength steels. These steels are under development as a substitute to 1st (low alloy) and 2nd generation (high-Mn) steels, aiming at improved combinations of strength and ductility [1-4]. In medium-Mn steels, the manganese content is in the range between 3 and 12 pct and the microstructure consists of an ultrafine ferriteaustenite mixture. The transformation-induced plasticity (TRIP) of the retained austenite is responsible for the enhanced formability in these steels. Austenite stability is the key factor controlling TRIP interactions and several processing routes have been developed in order to stabilize the austenite such as the quench and partitioning (Q&P) process [5,6] and intercritical annealing [7-12]. In the second process, austenite is stabilized by carbon and manganese partitioning. The retained austenite fraction and stability depend, therefore, on the intercritical annealing temperature and time. Understanding the kinetics of phase transformations during intercritical annealing is a prerequisite towards designing steel compositions and annealing treatments for austenite stabilization. The study of cyclic α→γ and γ→α transformations in the intercritical range has been proposed as a means to investigate the growth kinetics in low-Mn and low-C Fe- Mn-C alloys [13,14]. There are certain advantages in studying cyclic phase transformations. The first is that growth can be isolated and studied exclusively without the intervention of nucleation. The second stems from the fact that α→γ and γ→α transformations proceed at different rates isothermally, and, therefore, cyclic transformations can provide insight in the growth kinetics. In the present work, the cyclic transformation approach was applied in medium-Mn steels. The aim of the work is to describe growth during α→γ and γ→α transformations by monitoring the position and the velocity of the α/γ interface with temperature and time and to quantify specific stages of the transformation such as the “stagnant” and “inverse” stages described in [14]. Solute partitioning between austenite and ferrite during cyclic transformations is under investigation and has not been considered in detail in this work.
2. Methodology
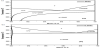
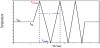
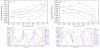
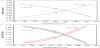
The steel under investigation was a medium-Mn, Fe-0.2C-5Mn. A lean-Mn Fe-0.2C-0.2Mn and a plain carbon Fe-0.2C steel were also considered as reference materials (compositions in mass%).Critical A1 and A3 temperatures were identified by constructing the respective isopleth sections at constant Mn compositions, as shown in Figure 1. The cyclic thermal treatment considered is depicted in Figure 2. The cycle starts with an isothermal holding at Tis, followed by temperature cycling between Tmax and Tmin.
Two cases were considered. The first case is concerned with the α→γ transformation, corresponding to the intercritical annealing of supersaturated ferrite (martensite) to form austenite. The second case is concerned with the γ→α transformation, corresponding to ferrite formation from an initially austenitic phase. For each steel, the values of Tis, Tmax and Tmin were specifically chosen to span the entire range of the α+γ region of the phase diagram. The temperature range ΔT=Tmax- Tmin, the heating and cooling rates, HR and CR respectively, as well as the period of the cycle τ, were kept constant for the three steels, in order to ensure a maximum possible degree of correspondence between the cycles for the three materials. The above values are shown in Table 1. The equilibrium austenite and ferrite fractions, fγ and fα respectively, at Tis were computed with Thermo-Calc [15] using the TCFE6 database for ferrous alloys and are also shown in Table 1.

Austenite and ferrite growth during the cyclic transformations was simulated by DICTRA [16] using the MOBFE2 mobility database for ferrous alloys. A single cell planar geometry was employed, shown in Figure3 for the α→γ and γ→α cases. The total region size was taken equal to 1.55 μm corresponding to one-half the measured ferrite-to-austenite mean distance (center-to-center) from ref. [17]. A thin austenite slice was attached to the left of the ferrite region in Figure 3a for the α→γ case. Correspondingly a thin ferrite slice was attached to the left of the austenite region in Figure 3b for the γ→α case. The regions were discretized with a linear grid consisting of 100 grid points. The initial compositions of austenite slice and ferrite in Figure 3a were taken equal to the nominal compositions of the alloy. The same holds for the ferrite slice and austenite region in Figure 3b.
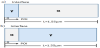
Although the compositions in the two phases are identical, the respective activities are not. Diffusional fluxes are generated between the two phases as a response to the activity gradients. Zero flux boundary conditions (closed system) were considered at the upper and lower boundaries of the system. Throughout the simulation, local equilibrium (LE) conditions were imposed. The parameters monitored were (a) the position of the α/γ interface, normalized to the total region size, corresponding to the volume fractions fγ and fα of austenite and ferrite for the α→γ and γ→α cases respectively, and (b) the velocity of the α/γ interface (VOI).
3. Results and Discussion
3.1 Fe-0.2C-5Mn steel
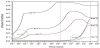
The isothermal α→γ and γ→α transformations in the Fe-0.2C-5Mn steel are depicted in Figure 4 for three temperatures 640, 675 and 710°C corresponding to the Tmin, Tis and Tmax of the respective cyclic treatment. The α→γ transformation exhibits the three-stage behavior discussed in [18,19], i.e. non-partitioning local equilibrium (NPLE) growth in stage I controlled by carbon diffusion in ferrite, partitioning local equilibrium (PLE) growth in stage II controlled by manganese diffusion in ferrite and PLE shrinkage of austenite in stage III controlled by manganese diffusion in austenite. Compared with the α→γ, the γ→α transformation is much slower. Two specific times, ts, were identified as the start of the cyclic transformations. In the first case ts=1x10⁸ sec after equilibrium volume fractions for both austenite and ferrite have been established in the isothermal transformation. In the second case, ts=2x10³ sec, where the α→γ transformation is evolving while the γ→α transformation is very sluggish. These times are depicted by dotted lines in Figure 4.
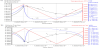
The details of the inverse transformation are depicted in a magnified region in the second cycle of Figures 5c and 5d in Figures 6a and 6b respectively for the α→γ and the γ→α cases. Point C on the volume fraction curve corresponds to the point of temperature change at Tmax while point D corresponds to the change of interface direction at VOI=0. Accordingly point E on the volume fraction curve corresponds to the point of temperature change at Tmin while point F corresponds to the change of interface direction at VOI=0. The duration of the inverse transformation is larger at Tmin, than the respective duration at Tmax. The phase fraction formed during the inverse transformation is larger at the maximum temperature of the cycle. A question, which arises, is whether there is a stagnant stage after the inverse transformation stage, observed in [14], where the transformation is sluggish with the temperature change. According to Figure 6 there is no absolute stagnant stage, i.e. a period where VOI=0. The interface is migrating continuously at low velocities even when it changes direction at VOI=0. So a ‘stagnant stage’ characterized by very low interface velocity, is also observed in 5Mn steel.
The cyclic transformation for ts=2x10³ sec is depicted for the α→γ case in Figure 7. The fγ vs temperature is shown in Figure 7a and the fγ, T and VOI vs time are shown in Figure 7b.
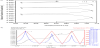
Since in this case at ts=2x10³ sec, the γ→α transformation during the isothermal treatment (Figure 4) is sluggish, the fγ during cyclic transformation does not form hysteresis loops. On the contrary the fγ increases in each cycle, both in the heating and cooling part. In this case austenite forms by inverse transformation during the cooling part of the cycle.
3.2 Fe-0.2C and Fe-0.2C-0.2Mn steels
The isothermal transformations for the two steels are shown in Figure8a and 8b. The kinetics of ferrite formation is much faster than in the Fe-0.2C-5Mn steel. The times ts indicating the start of the cyclic transformations are indicated by dotted lines.
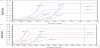
The cyclic transformations (volume fraction vs temperature) for the two casesα→γ and γ→α for the Fe-0.2C and Fe-0.2C-0.2Mn steels are shown in Figure 9a and 9b for ts=100 and ts=1x10⁷ sec respectively, corresponding to times where equilibrium fractions have been established in the respective isothermal curves. In the case of Fe-0.2C steel containing no manganese, the transformation is reversible and no hysteresis loops are formed. This is due to the fast diffusion of carbon, establishing global equilibrium conditions quickly. In the case of the steel containing 0.2Mn, a hysteresis loop forms during cycling transformation. The width of the loop, in the temperature axis, is smaller than the loops in the 5Mn steel. Obviously the partitioning of manganese during the cyclic transformations is the controlling factor for loop formation and inverse transformation stages. This issue is currently under investigation.
4. Conclusion
Cyclic phase transformations were simulated in Fe-0.2C-5Mn steel as well as in Fe-0.2C and Fe-0.2C-0.2Mn steels for comparison. From the results of the simulations the following conclusions can be drawn.
- The cyclic behavior for a specific steel composition depends on the starting time of the cyclic treatment relative to the isothermal transformation curve.
- When the cyclic treatment is performed after the equilibrium phase fractions during isothermal treatment have been established, hysteresis loops form in the Fe-0.2C-5Mn and Fe- 0.2C-0.2Mn steels. The cyclic behavior is fully reversible for the Fe-0.2C steel.
- The inverse transformation stage has been investigated for the Fe-0.2C-5Mn steel. The duration of the inverse transformation stage is larger at the minimum temperature of the cycle. The phase fraction formed during the inverse transformation is larger at the maximum temperature of the cycle.
- In Fe-0.2C-5Mn steel, when the cyclic transformation takes place at a time before the final phase equilibrium in the isothermal curve, the transformation is characterized as inverse during the whole cooling part of the cycle.
- A stagnant stage, where the transformation is very sluggish was observed during the cyclic transformations for the steels investigated.
Competing Interests
The authors declare that they have no competing interests exit.
Author Contributions
P.I Sarafoglou contributed to this work by carrying out simulations and supervising article content. Also contributed to the interpretation of the results.
M.I.T. Tzini contributed by carrying out simulations and by performing parametric analysis.
G.N. Haidemenopoulos contributed by designing the simulations, supervising the simulation work and interpreting the results.
Acknowledgments
The work has been conducted in the framework of the IKYDA 2014-2015 program “Design rules for 3rd generation advanced highstrength steels”, which is a collaboration between UTH and RWTHAachen.